
Amazon Segmentation
This project marked the conclusion of my studies at RevoU, serving as the final project. I was given the authority to choose my preferred dataset, understand the context, and observe possible business problems. I handled the end-to-end data analysis process, which involved defining the project scope, establishing the analysis approach, contributing to the data analysis, and creating data visualizations.
Client:
Self Project Amazon
Date:
June 27, 2025
Type:
Customer Segmentation
Role:
Data Analyst

About
This project marked the conclusion of my studies at RevoU, serving as the final project. I was given the authority to choose my preferred dataset, understand the context, and observe possible business problems. I handled the end-to-end data analysis process, which involved defining the project scope, establishing the analysis approach, contributing to the data analysis, and creating data visualizations.
Project Focuses :
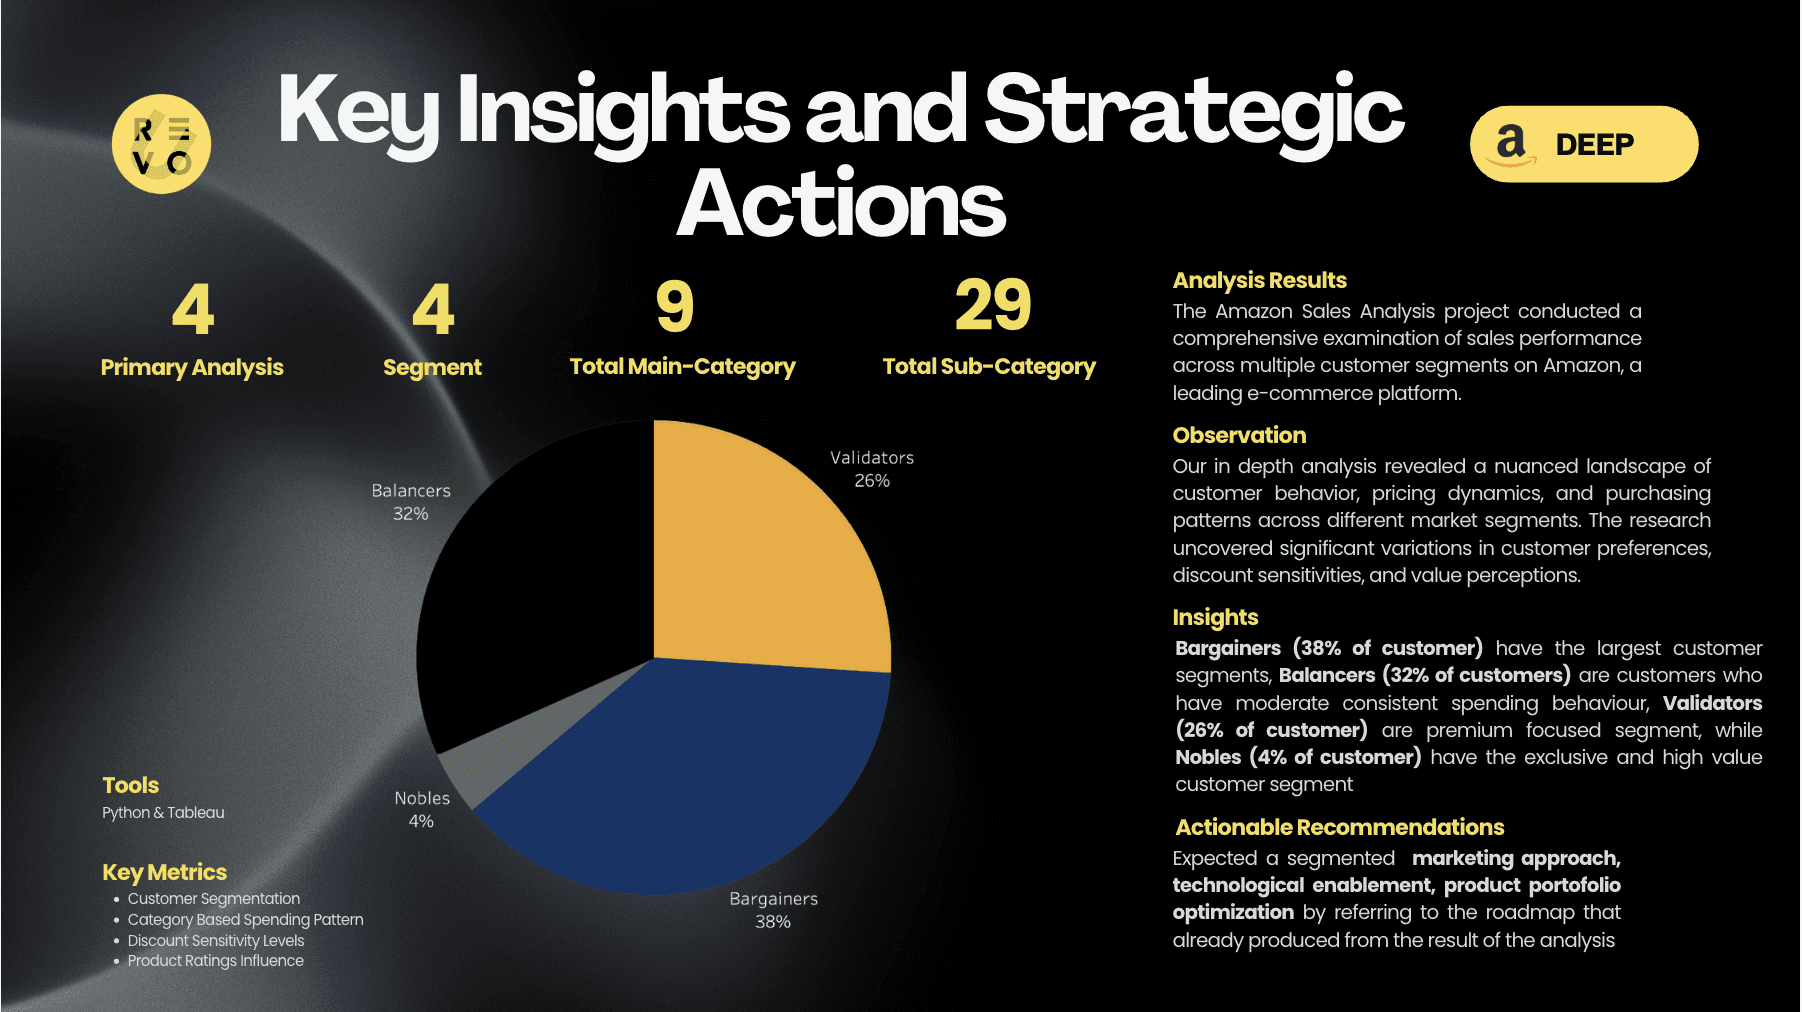
Analyzing Amazon sales data to identify distinct customer behavioral patterns and develop targeted marketing strategies. The analysis combines advanced data science techniques including K-Means clustering, feature engineering, and statistical analysis to transform raw e-commerce data into actionable business insights.
Problem Statement :
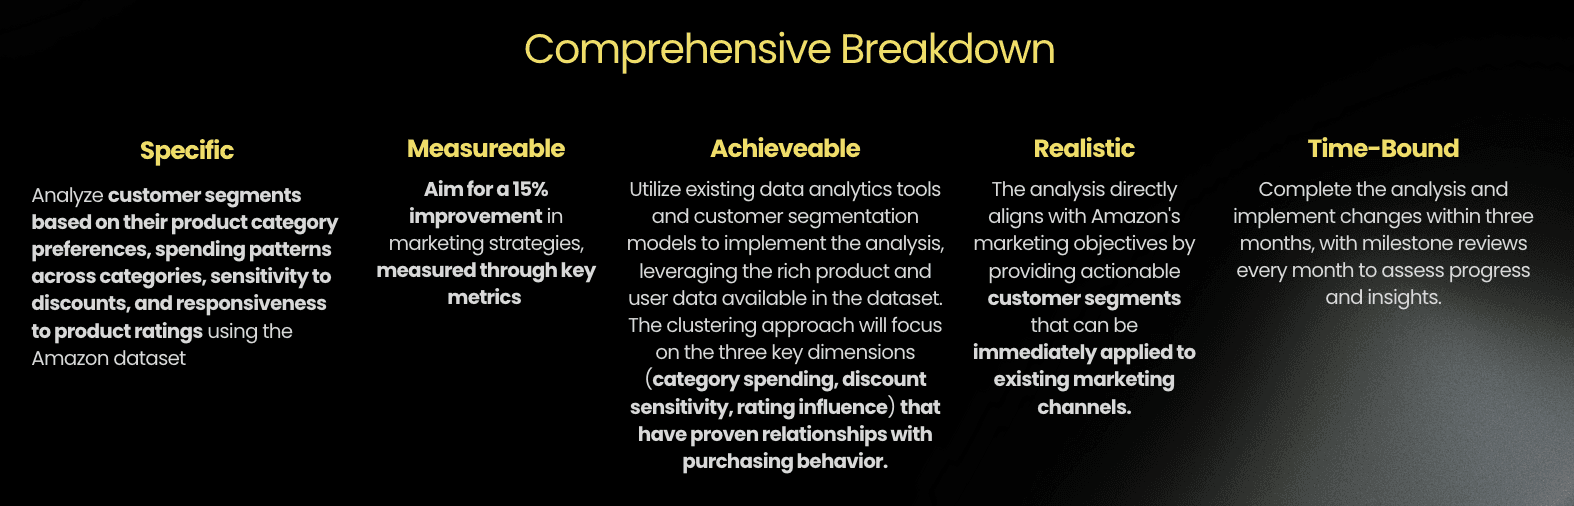
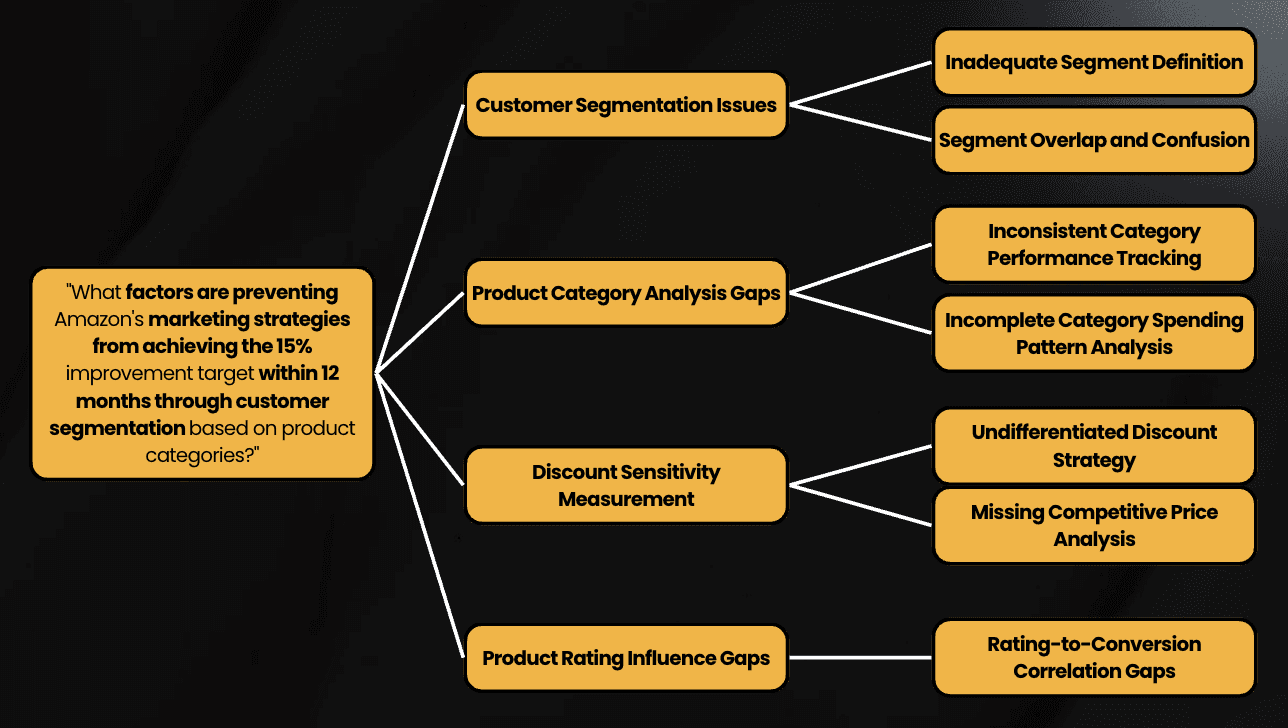
How can we improve Amazon’s marketing strategies by 15% within 12 months by analyzing customer segmentation based on spending behaviour in order to enhance customer targeting by identifying the Category Based Spending Patterns, Discount Sensitivity Levels, Product Rating Influence.
Key Deliverables
Comprehensive customer segmentation model identifying 4 distinct behavioral personas
Interactive Tableau dashboard for dynamic data exploration
Strategic marketing recommendations projected to increase ROI by 15%
Essential Link
Context
Amazon's vast marketplace generates enormous amounts of customer transaction data, creating both opportunities and challenges for businesses seeking to understand their customer base. With over 1,400 product records spanning multiple categories from Electronics to Home & Kitchen, the dataset represents a diverse customer ecosystem with varying purchasing behaviors, price sensitivities, and product preferences.
Business Environment
Multi-category e-commerce platform with diverse product offerings
Customers exhibiting varied purchasing patterns across different price points
Complex relationship between product ratings, discounts, and customer behavior
Need for data-driven marketing strategies to maximize customer lifetime value
Problem
Without clear understanding of customer segments, businesses struggle to implement effective marketing strategies, leading to suboptimal resource allocation and missed revenue opportunities.
Mutually Exclusive Collectively Exhaustive (MECE) Issue Tree
Business Impact
Potential revenue loss from untargeted marketing campaigns
Suboptimal inventory planning without understanding customer preferences
Missed opportunities for personalized customer experiences
Objective
The objective here was to developed a comprehensive customer segmentation model that enables data-driven marketing strategies and improves business performance.
Processes & Considerations
Step 1
Data Cleaning
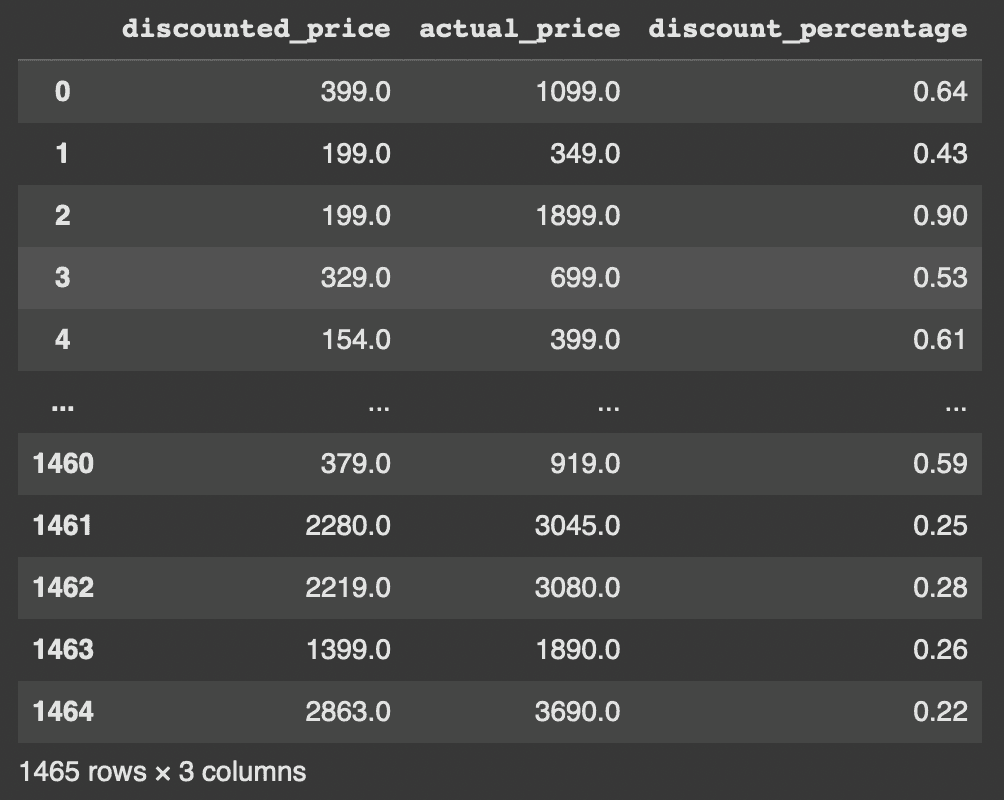
Identified and changed the Price Area Columns Data Type (discounted_price, actual_price, discount_percentage) to match the expected output to ease the exploratory data analysis phase for the price area section
Before Changed the Data Type
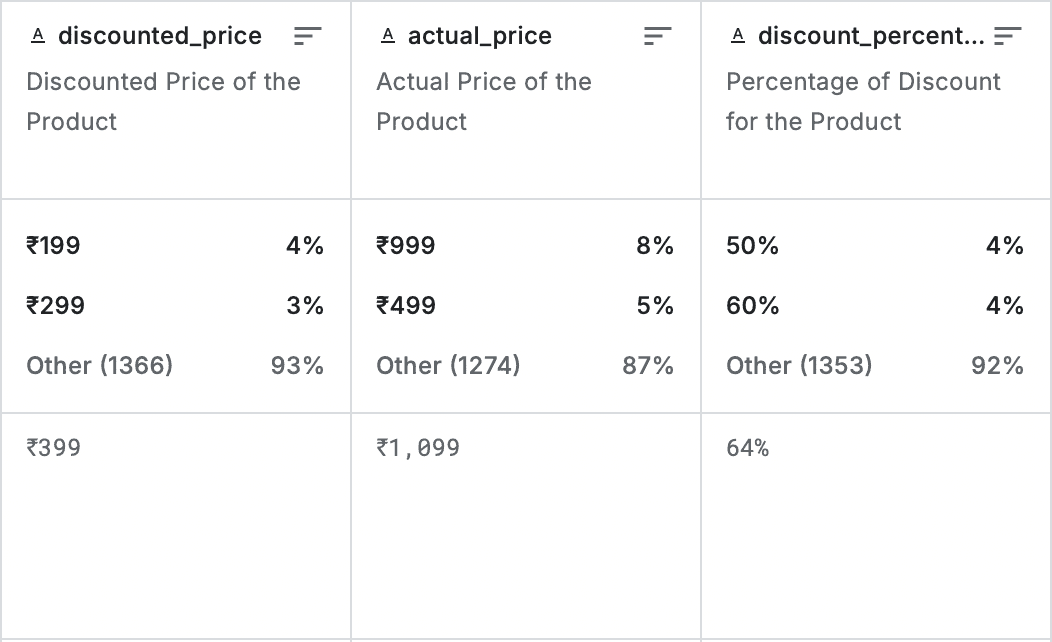
After Changed the Data Type
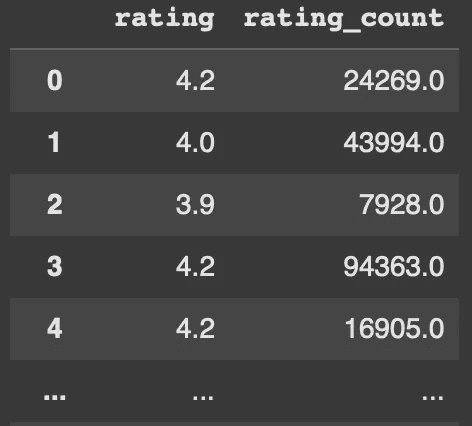
Identified and changed the Rating Area Columns Data Type, Found Unusual String, Inspected The Strange Row (rating and rating_count) to match the expected output to ease the exploratory data analysis phase for the rating area section
Before The Process
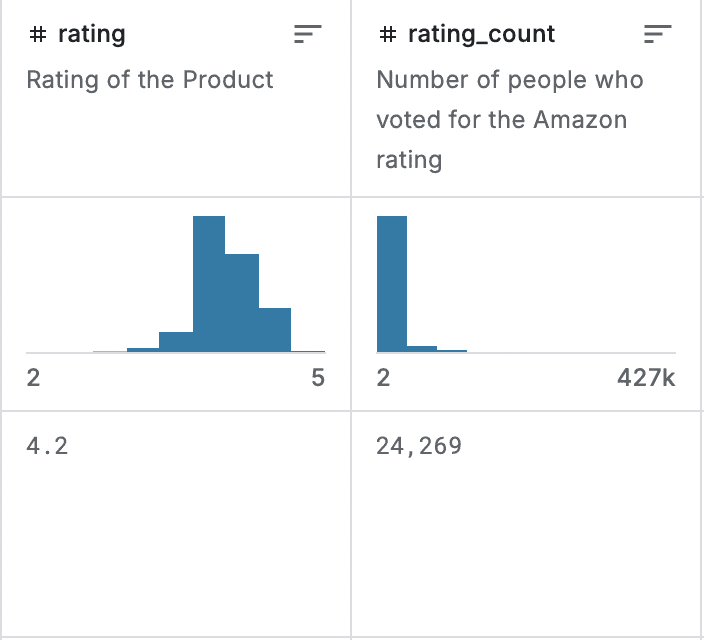
After The Process
Checked duplicates and filled missing values in the datasets
Duplicates | Missing Values |
|---|---|
there’s no duplicated rows | 2 values in rating_count was found |
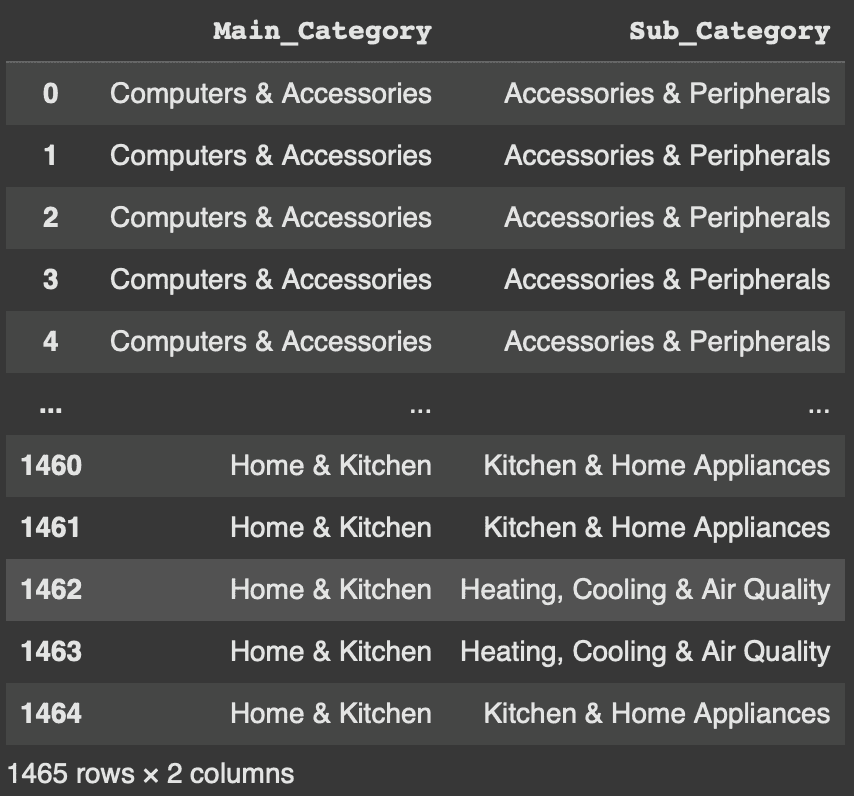
Created a new Product Category Data Frame from identifying which column included into Product or Category Section by differ the Category Naming and changed from the Category_1 and Category_2 into Main-Category and Sub-Category
Before the Process
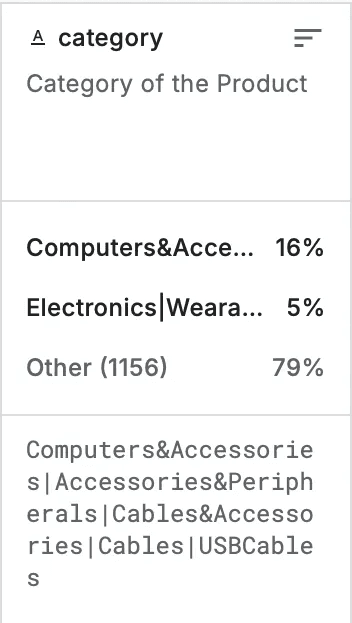
After the Process
Created Ranking Rating Score Categories into 5 types of ranking
Before Ranking Categories
There are only rating and rating_count
After Ranking Process
Now it also consist the rating_score based on the rating criteria
Created Reviewers based on the user section (user_id and user_name) by identifying and subset into one user_id belongs to one user_name as well as splitting each of the user_id and user_name into one to one
Before The Identifying Process
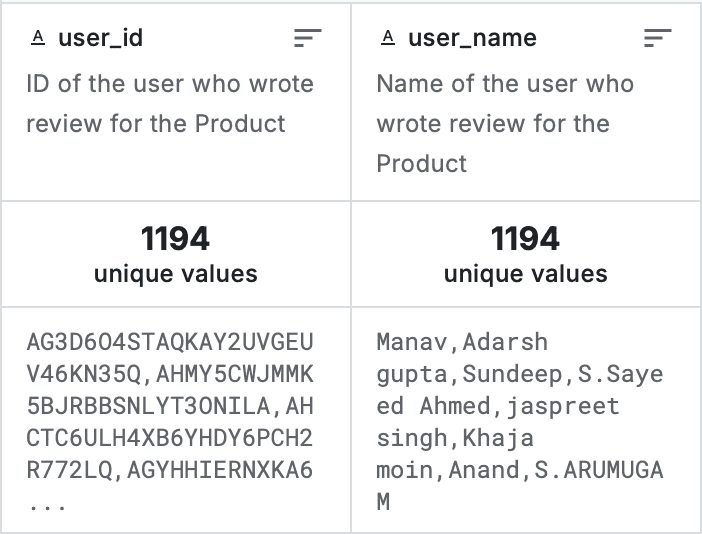
column for user are hard to define because there are no one to one relationship for each user
After The Analysing Process
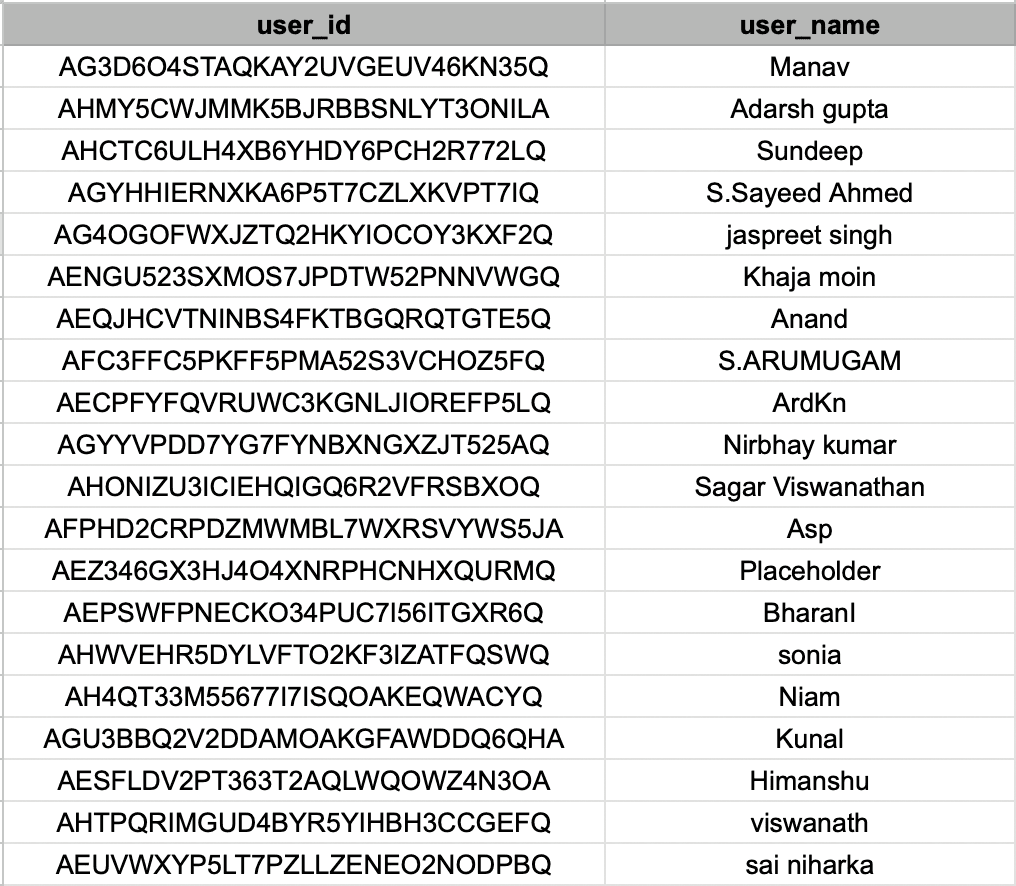
user one to one with their user_name and user_id
Step 2
Exploratory Data Analysis - Customer Segmentation Analysis
Assigned new Data Frame from the cleaning process to determine which features that belong to be analyzed for the cluster that correlate with Customer Segmentation Category By Product
Defined the scaler by identified the data, in this dataset I am using MinMaxScaler to standardize the data, why MinMaxScaler because in this case the data have a lot of identical value whereas as we can see it have a lot of 0.0 data and there a lot of customer as well who doesn't made a purchase
Filled the Nan-Values with 0 so it can perform a rigid analysis by analyzing all the essentials features, After the Scaling process I found 288 Nan Values where it leads to an impute of 0 values for each of Nan Values
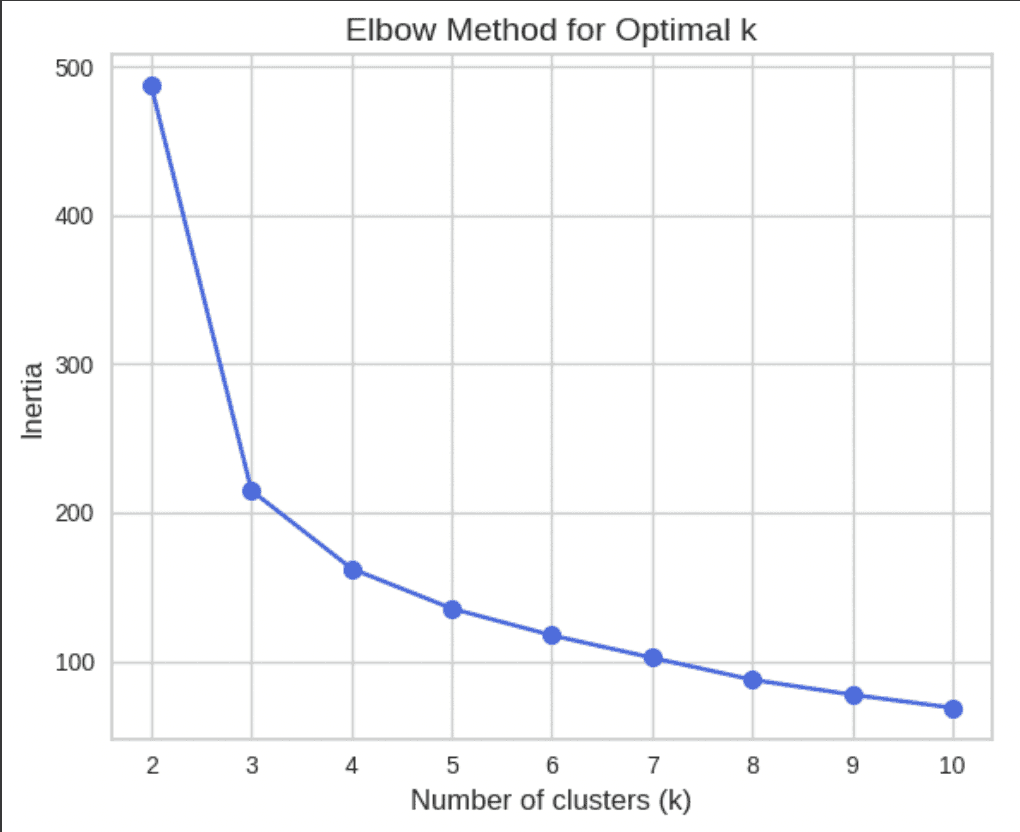
Plotted the Data Frame with Elbow and Silhouette Method to determine the K Values
Elbow Method (Code and Results)
In the chart, inertia drops sharply from k = 2 to k = 3, and then the rate of decrease slows down. The "elbow" appears around k = 4, where the decrease in inertia starts to level off. This indicates k = 4 may be an optimal number of clusters.
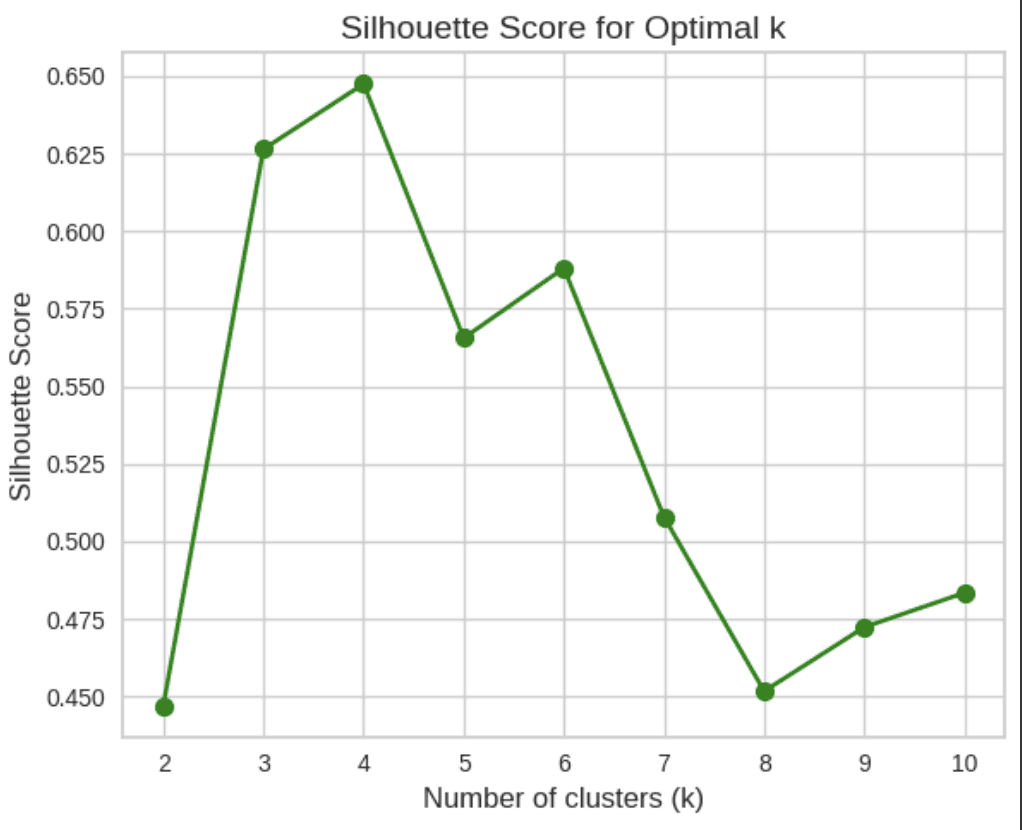
Silhouette Method (Code and Results)
In the chart, the highest silhouette score is observed at k = 4 (~0.65), suggesting the most natural clustering structure. Scores drop significantly after k = 4, which it provides the best cluster cohesion and separation according to the silhouette metric.
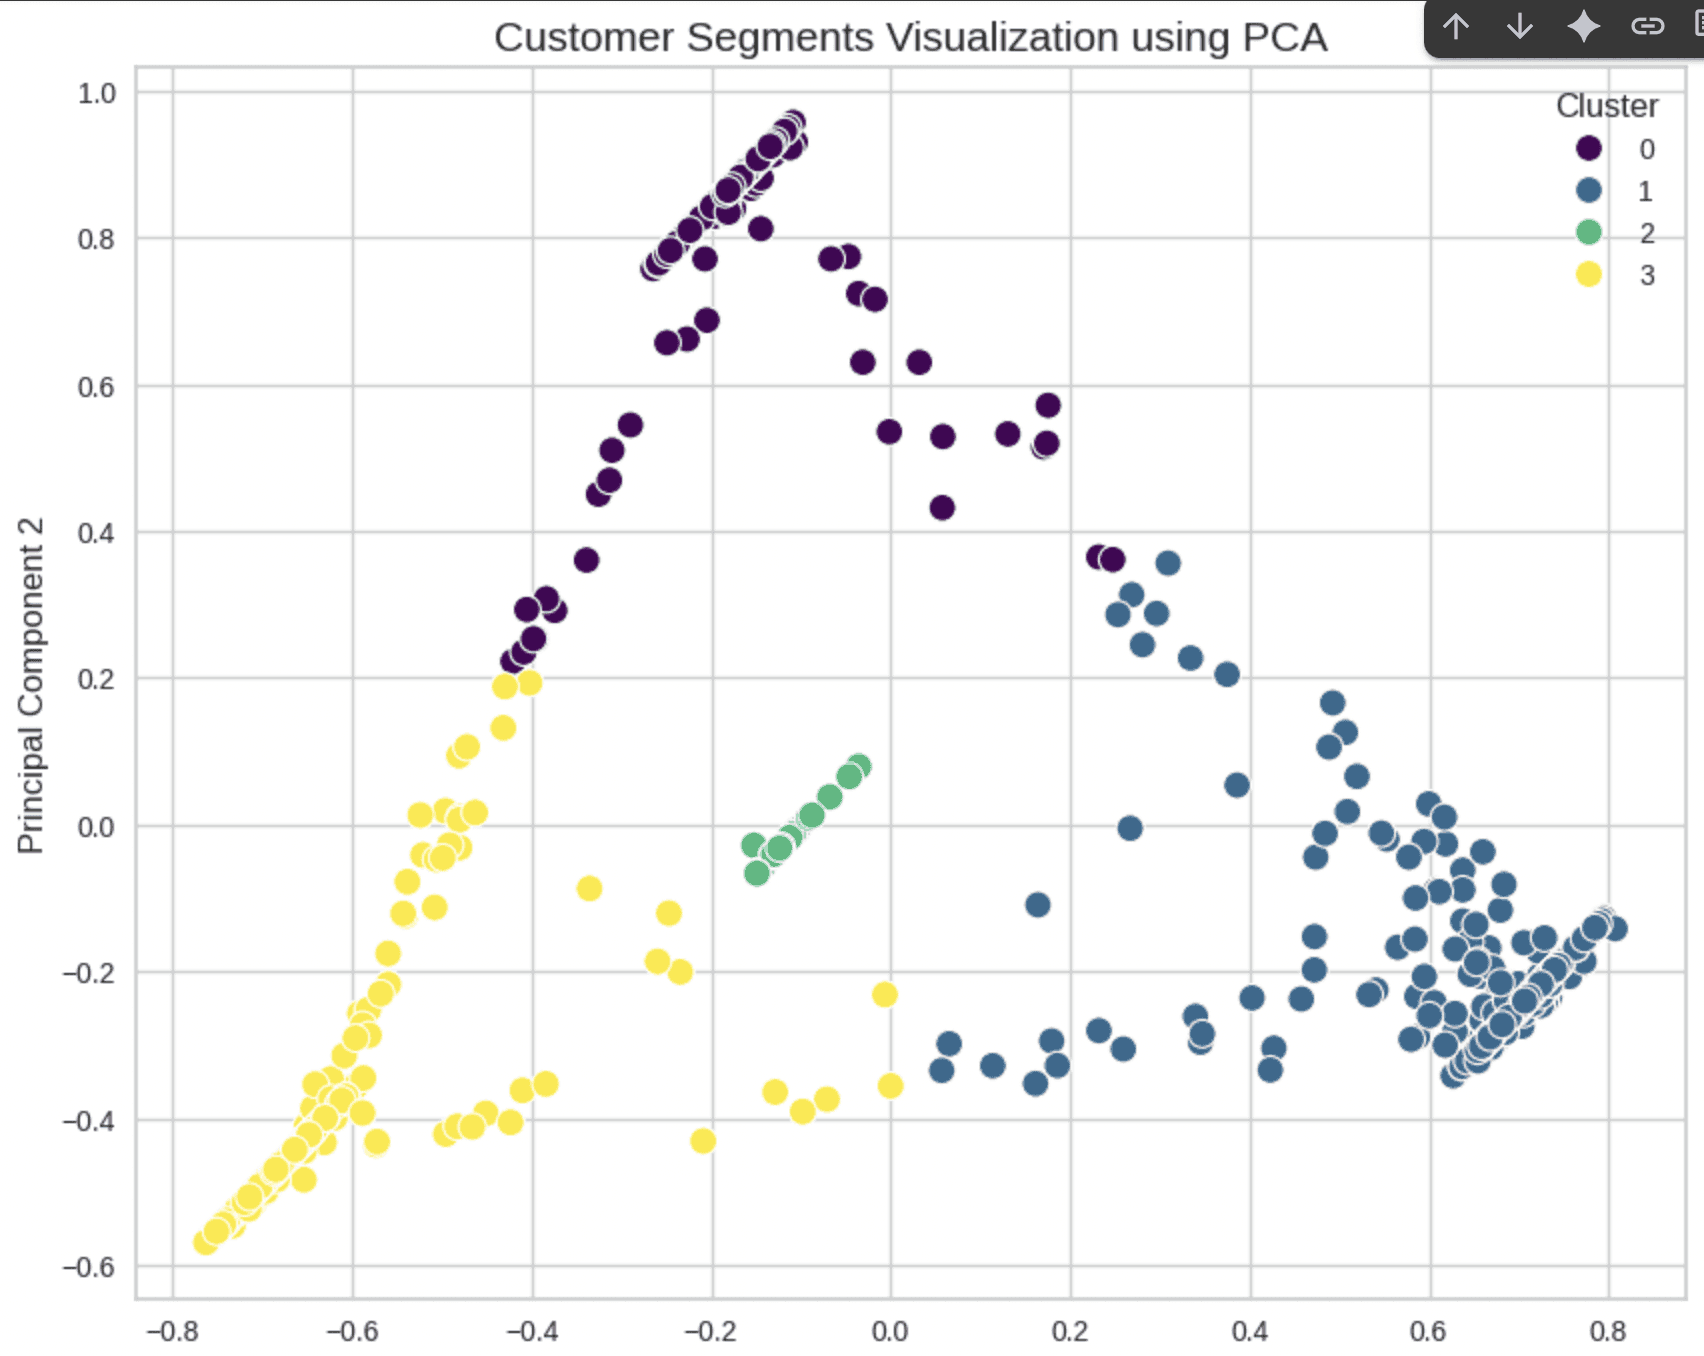
With the results of Elbow and Silhouette Method i chose K Values as 4, to differ the cluster or segmentation, to support the Customer Segmentation I use PCA Visualizations to outlook the variance of cluster
Plotted the results of Customer Segmentation by assigning it with each of their characteristics
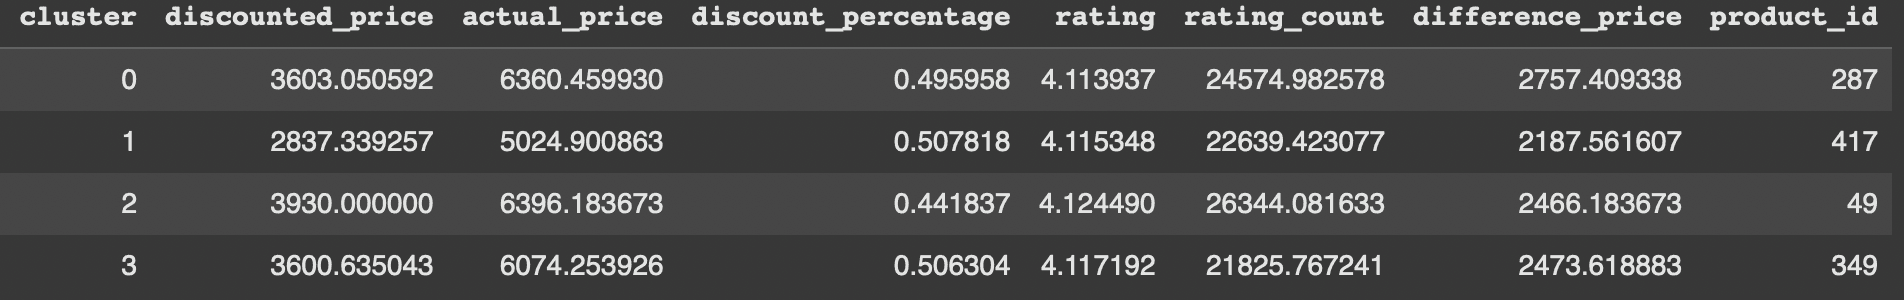
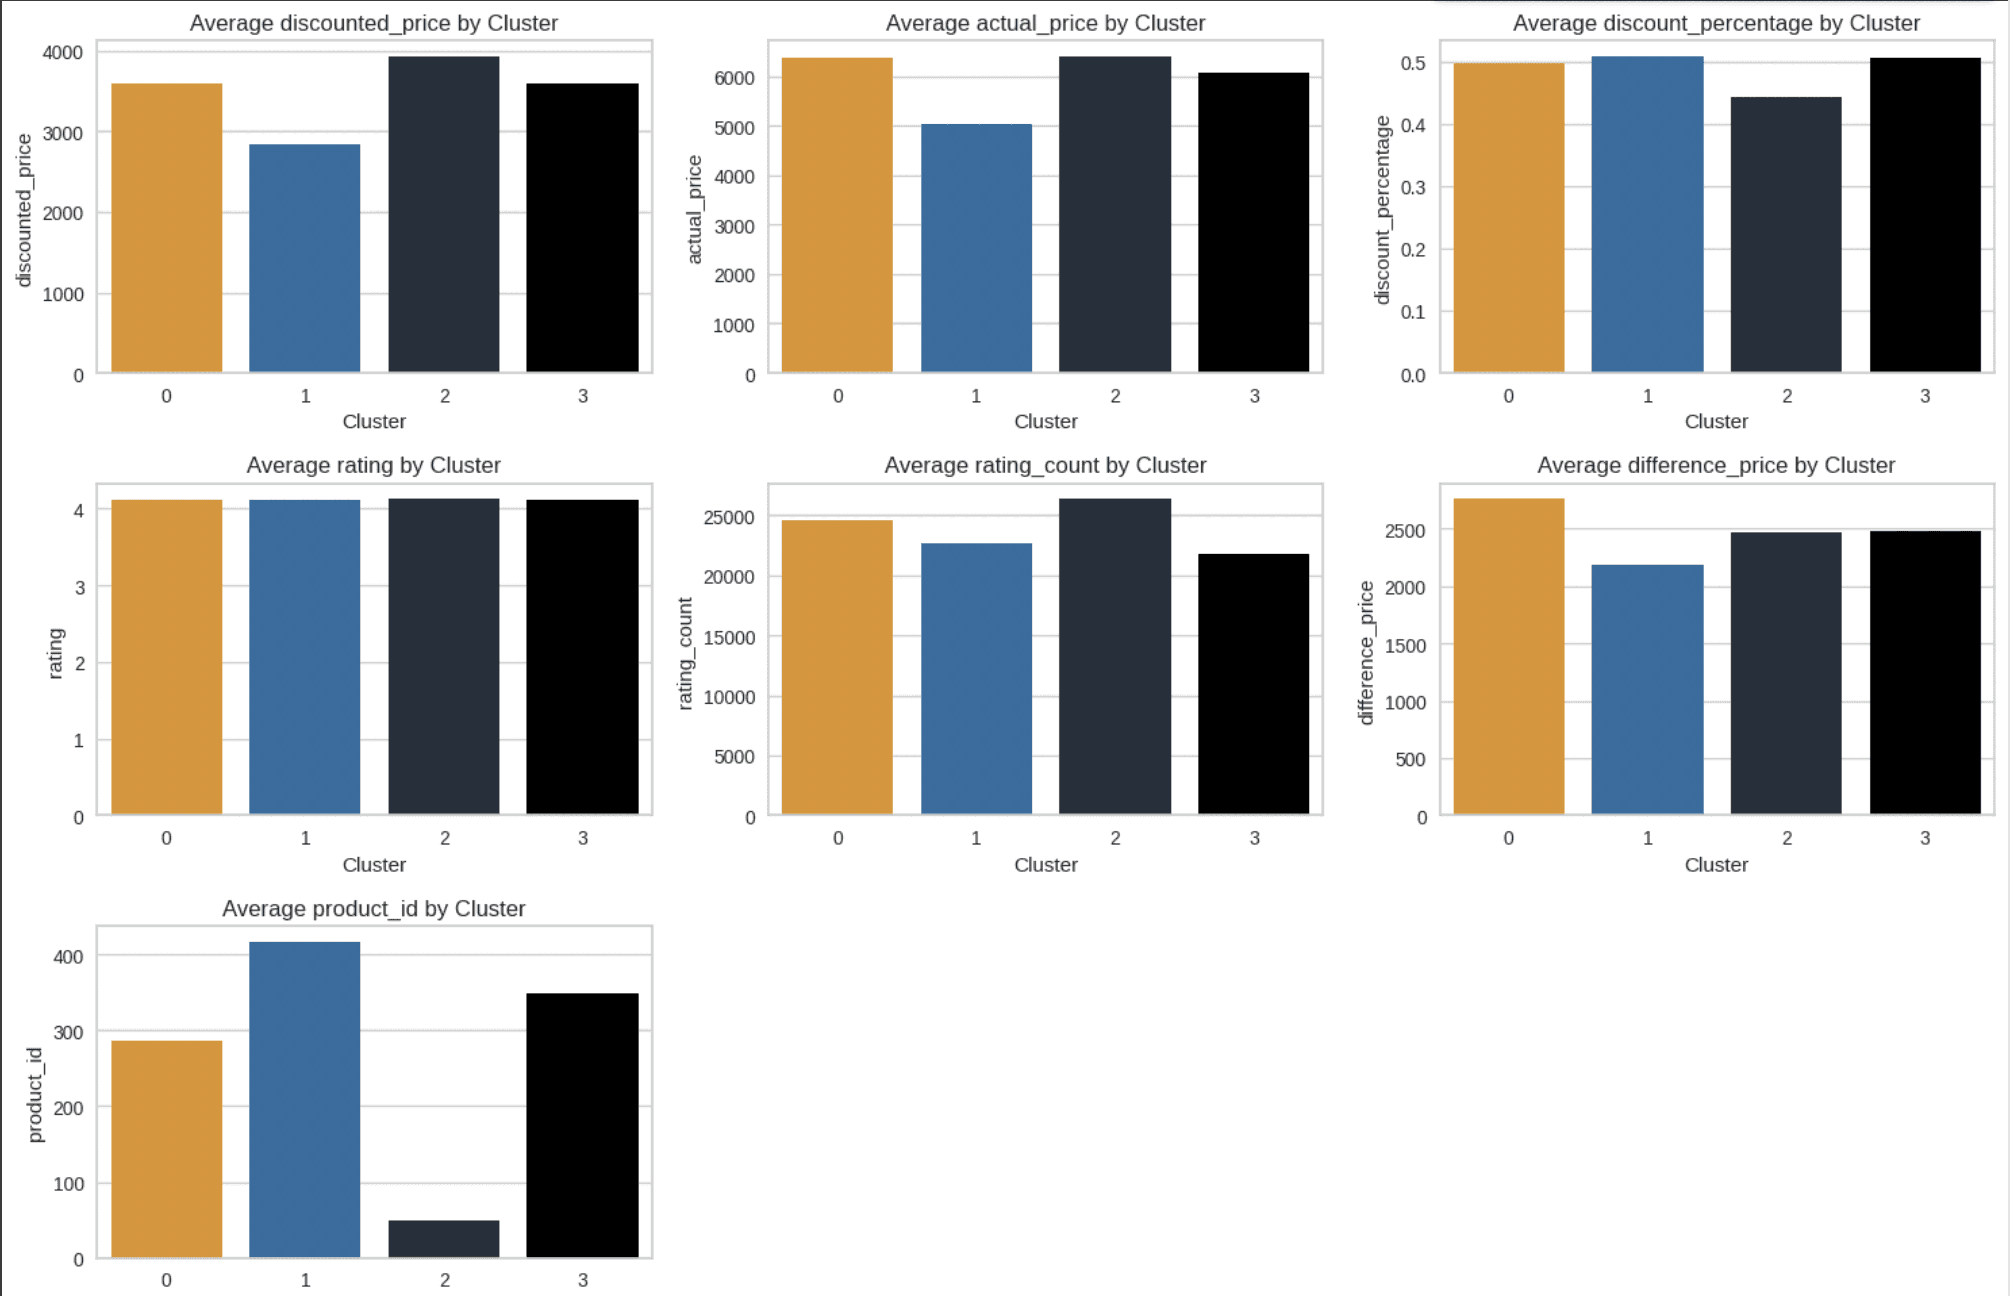
Visualization of Each Characteristic by using Category
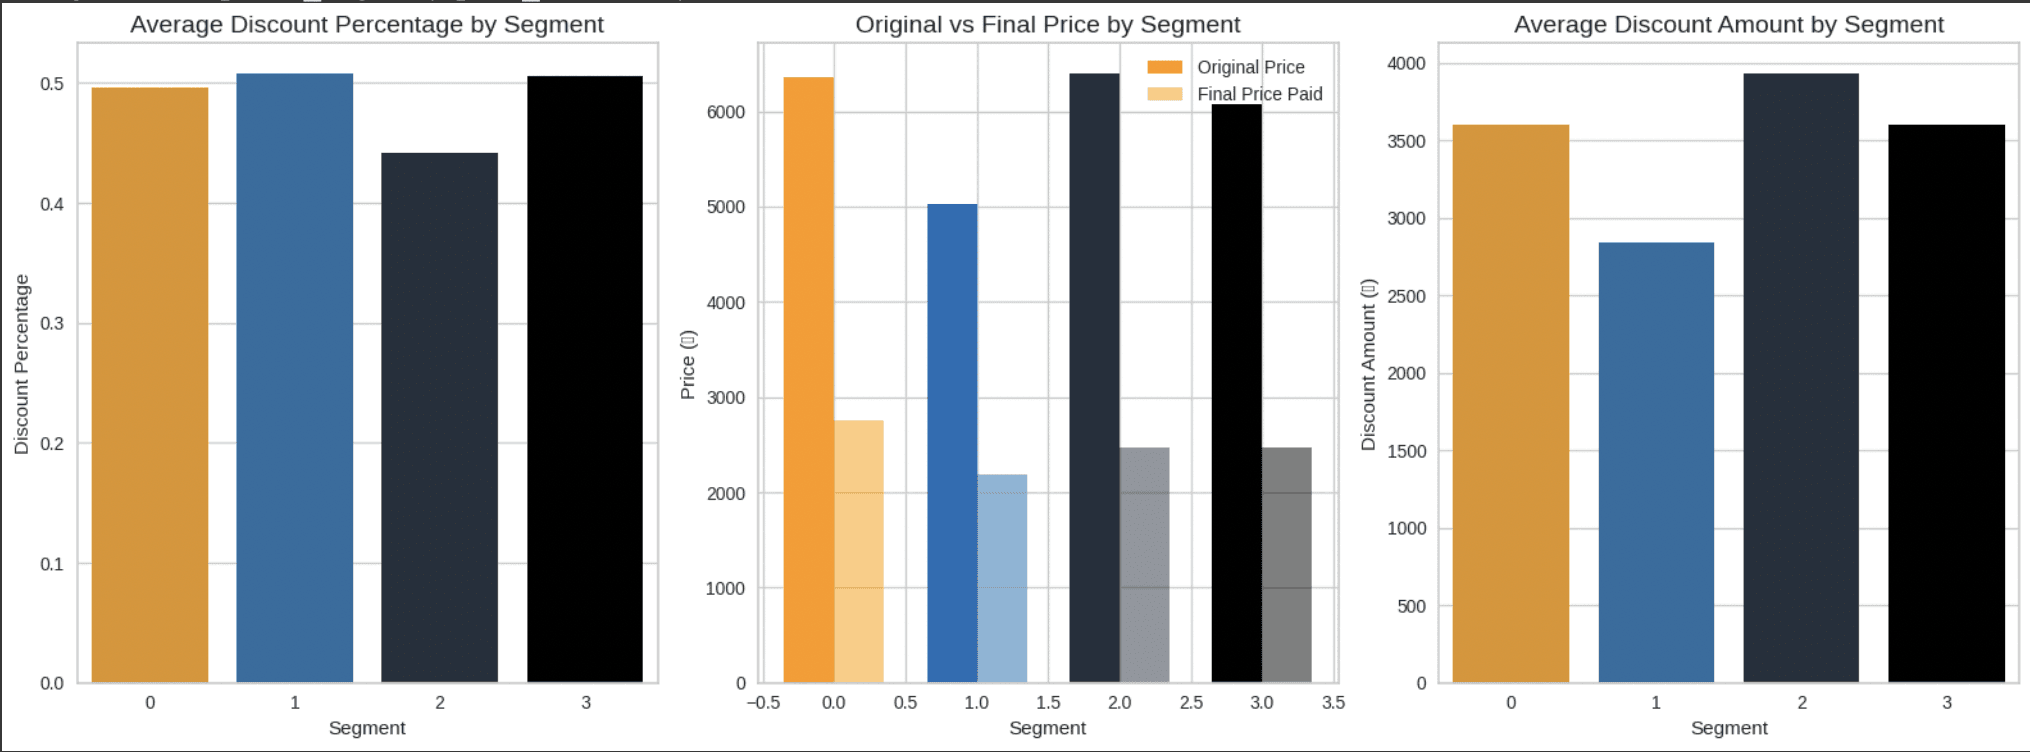
Analyzed the Segments Price Sensitivity
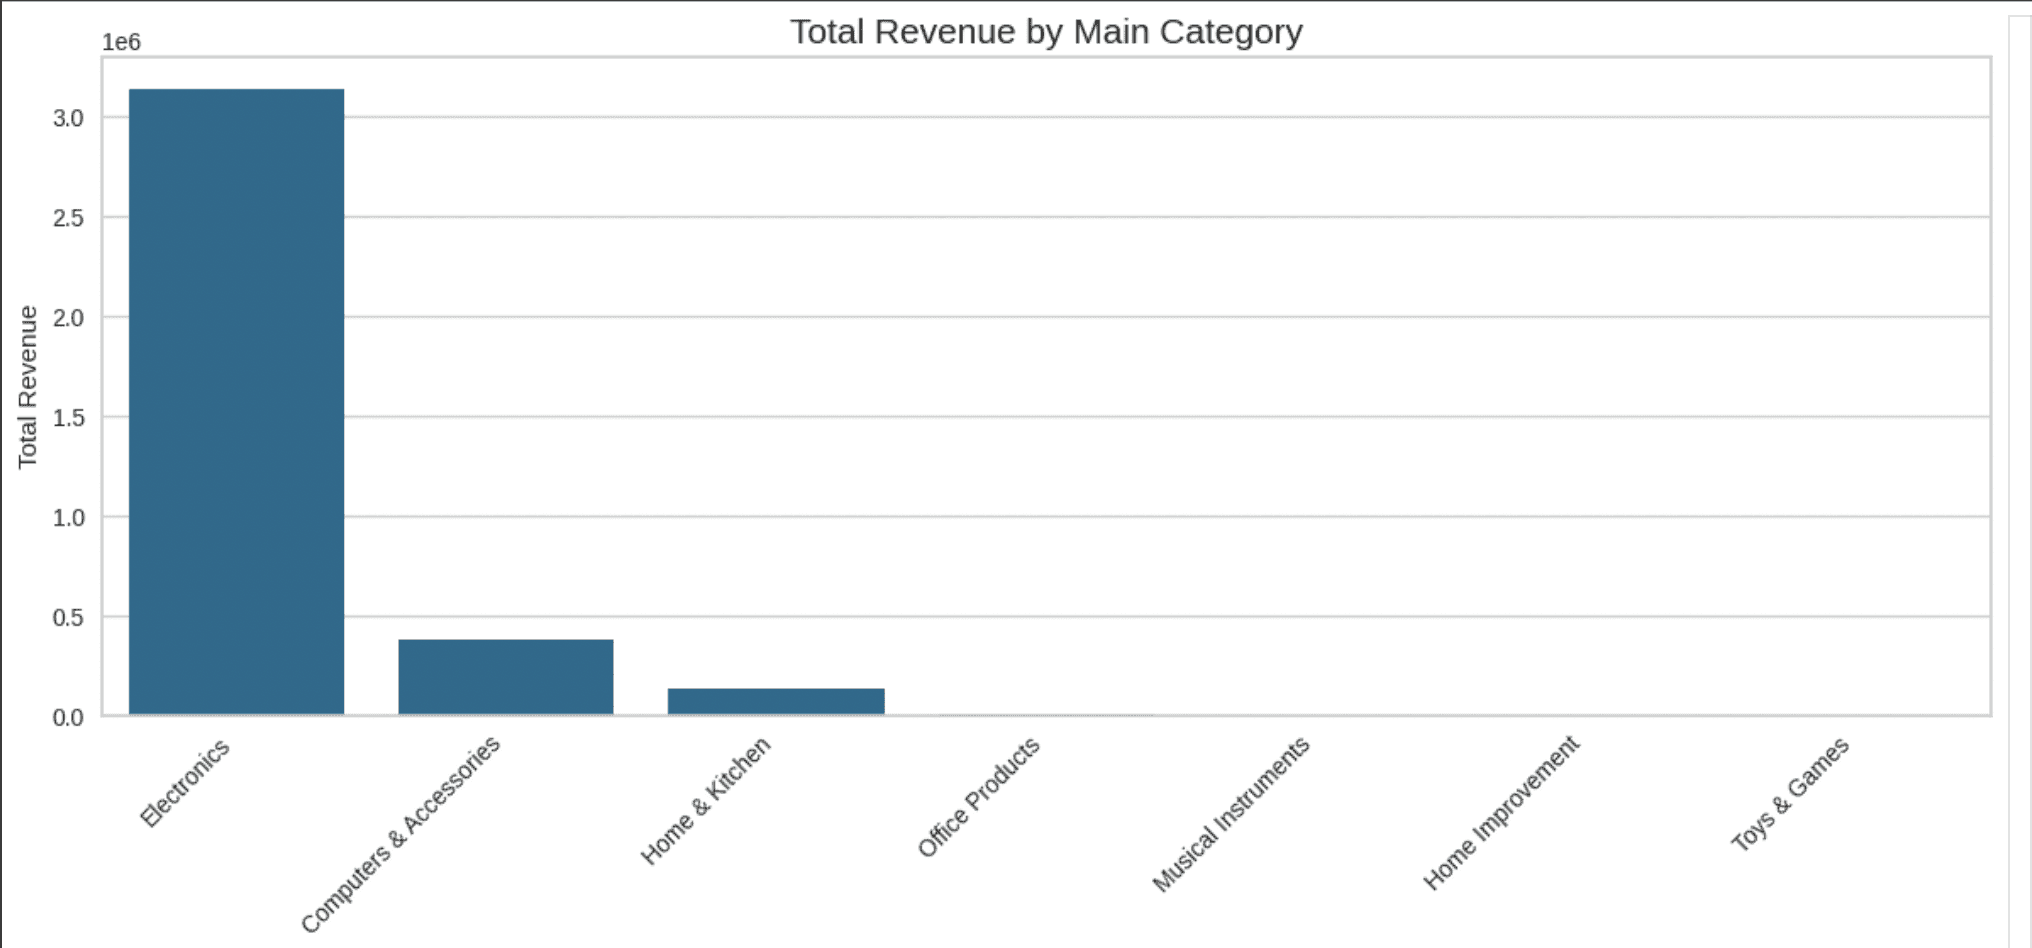
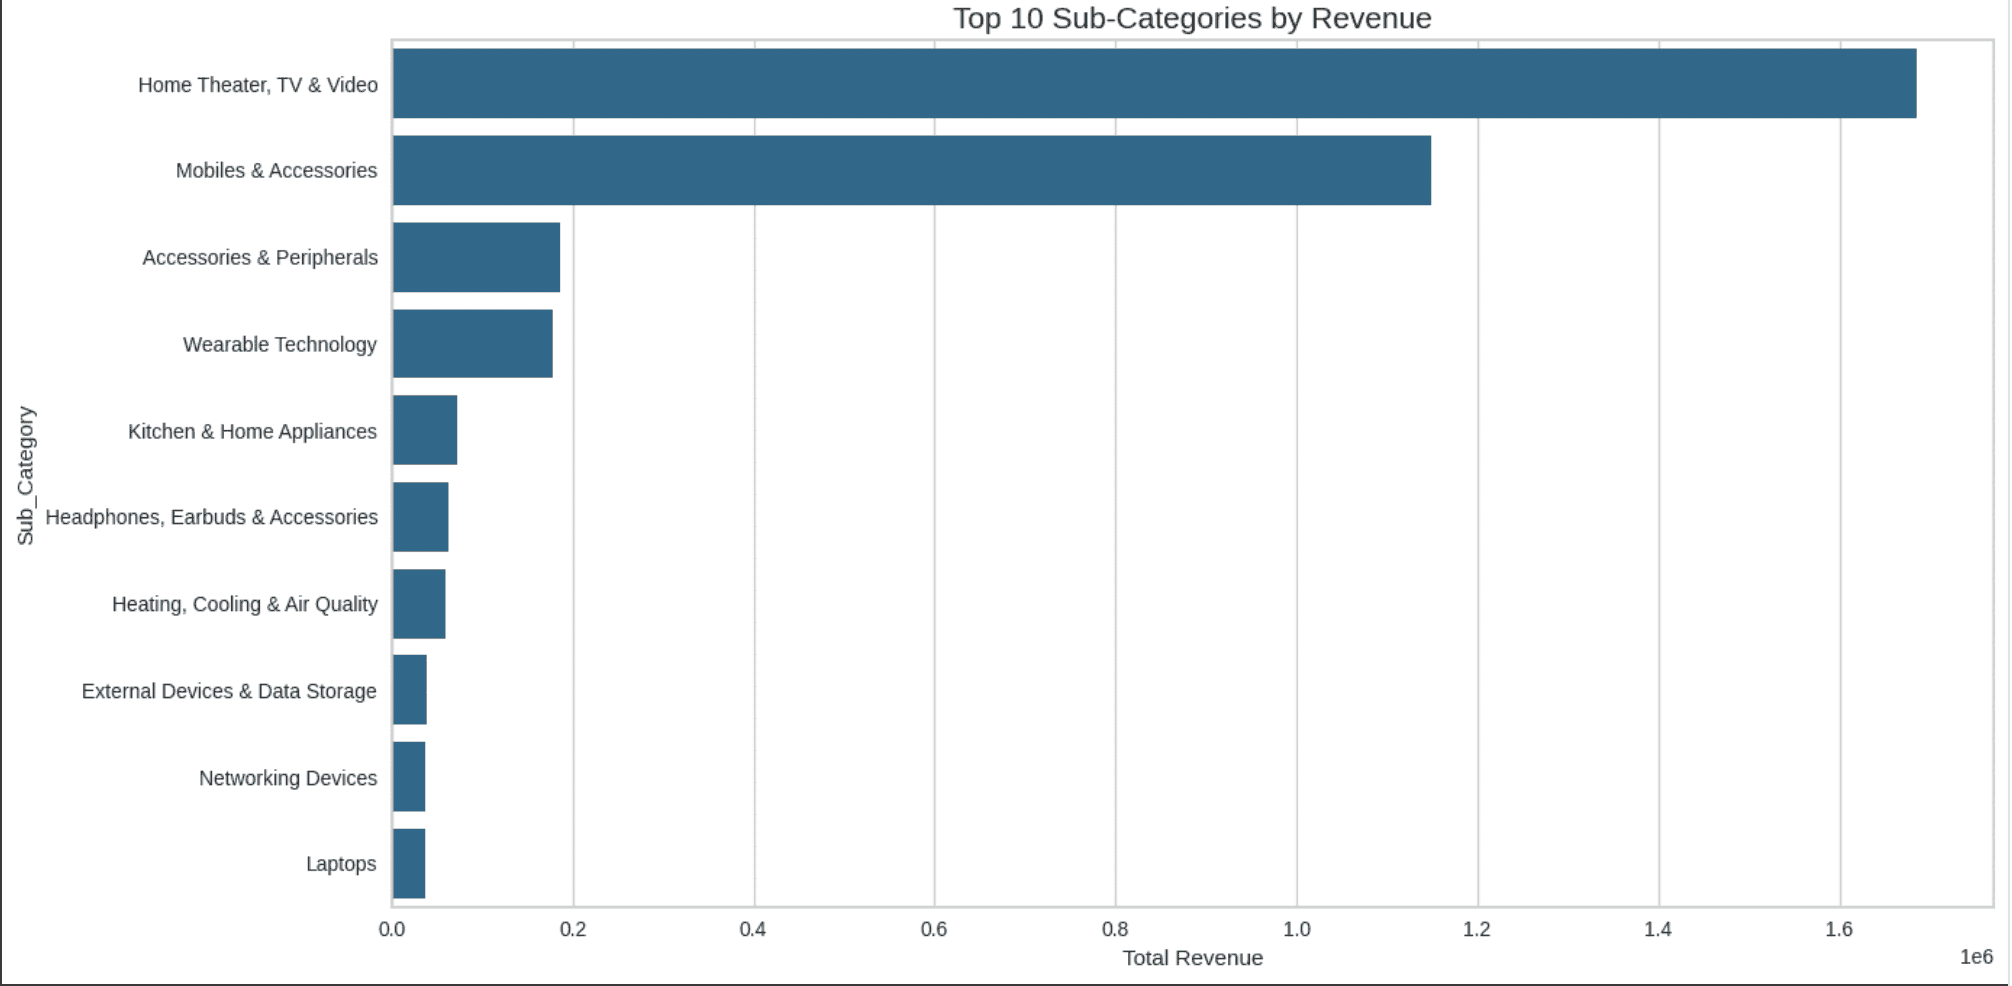
To pursue the customer spending behaviour analysis, I analyzed the category based spending pattern for the average spending main category and also the sub category
Average Spending Main Category
Average Spending Sub Category
Created the Discount Sensitivity Levels and Discount Bins to determine the discount level and discount differentiation into 5 bins of discount level
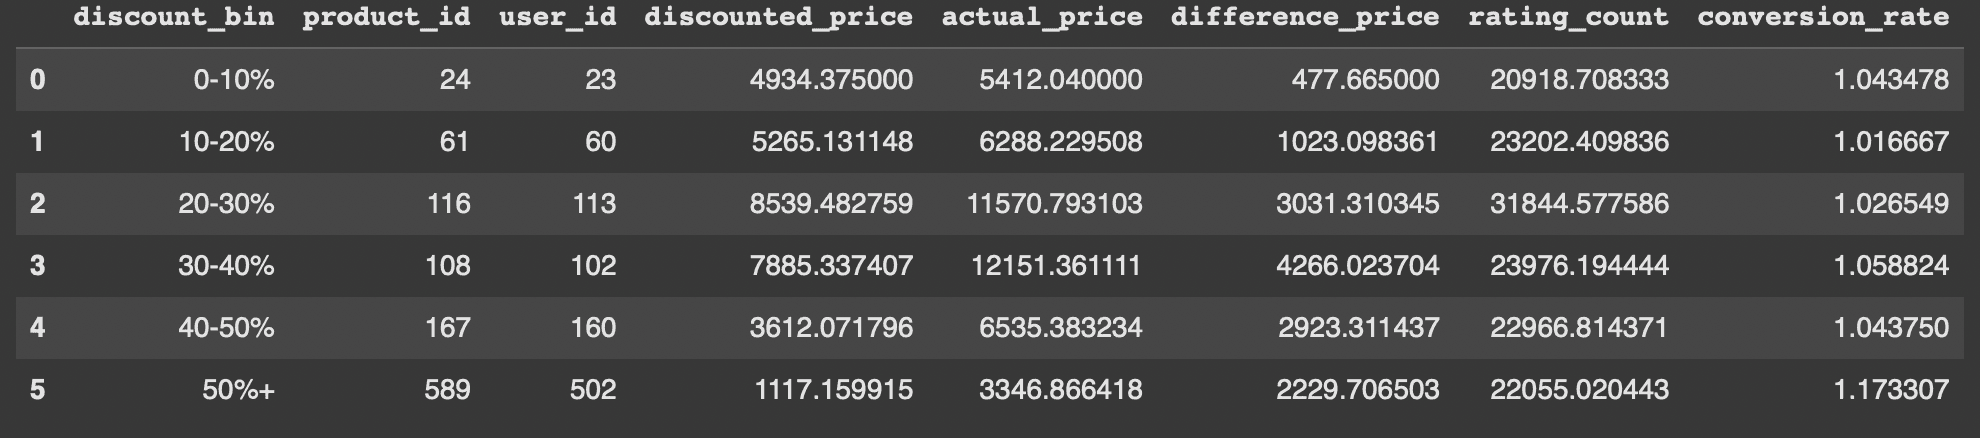
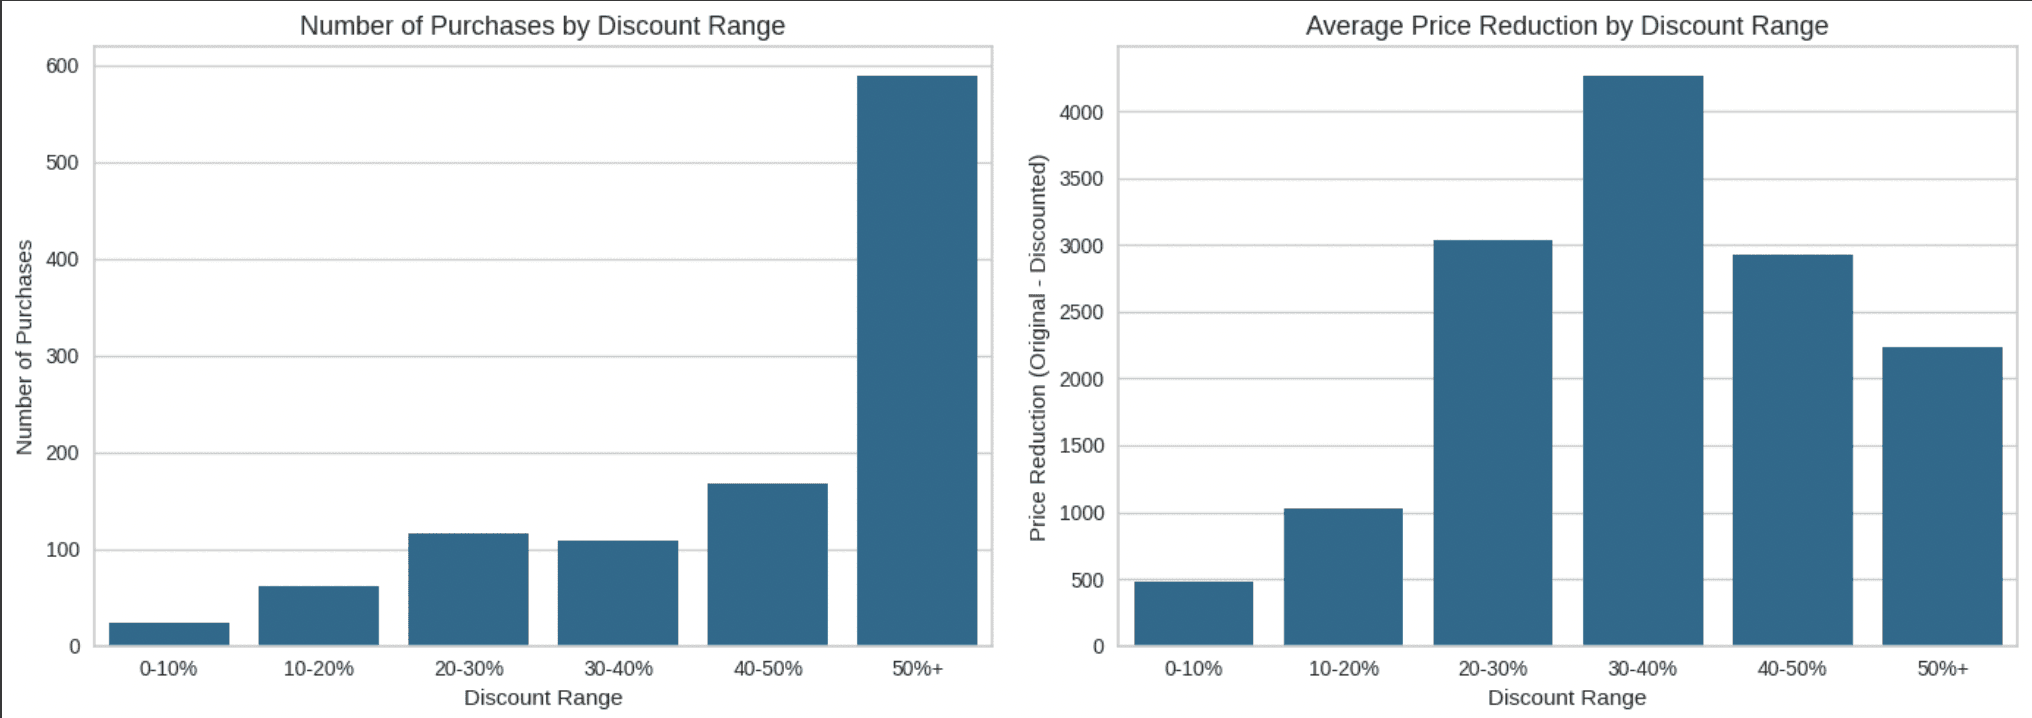
Number of Purchases and Average Price Reduction
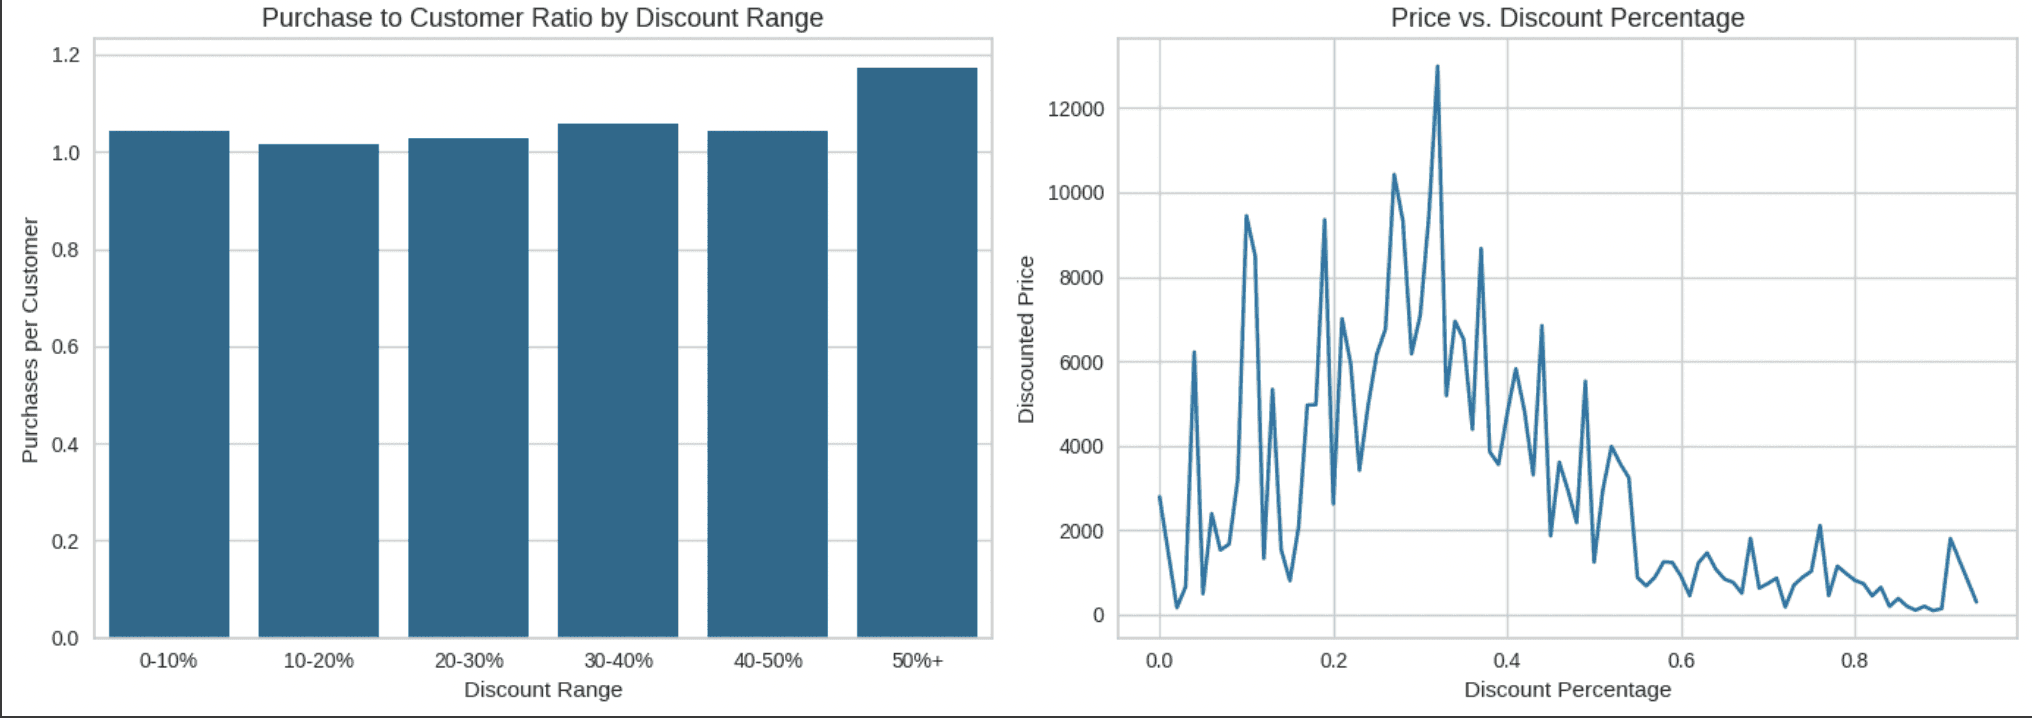
Purchase to Customer Ratio and Price compare to the Discount Percentage
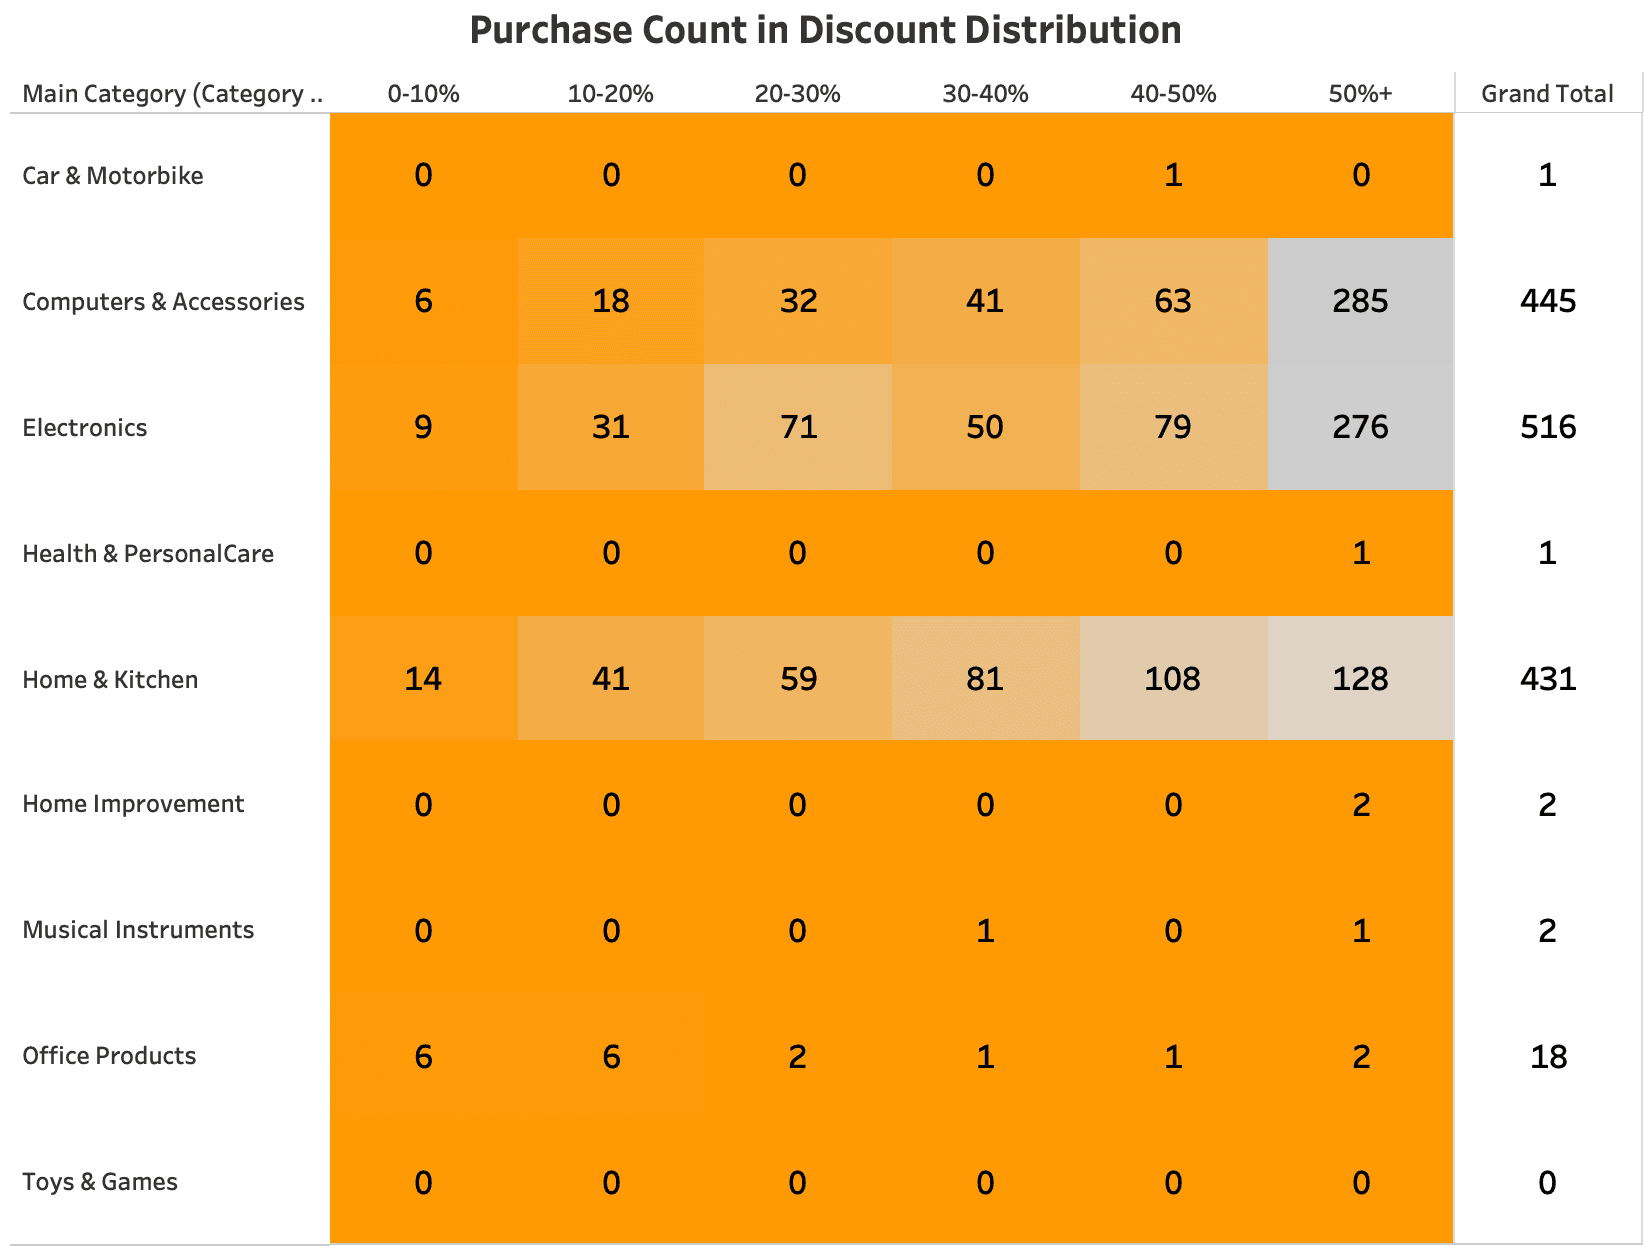
Had the visualization of how discount effected the price and also number of purchases, I managed to see the Discount Distribution by using Heatmap for the Main Category
To gain deeper understand of the customer spending behaviour I decided to analyzed the Product Ratings Influence Analysis to know how the rating influence the customer spending behaviour.
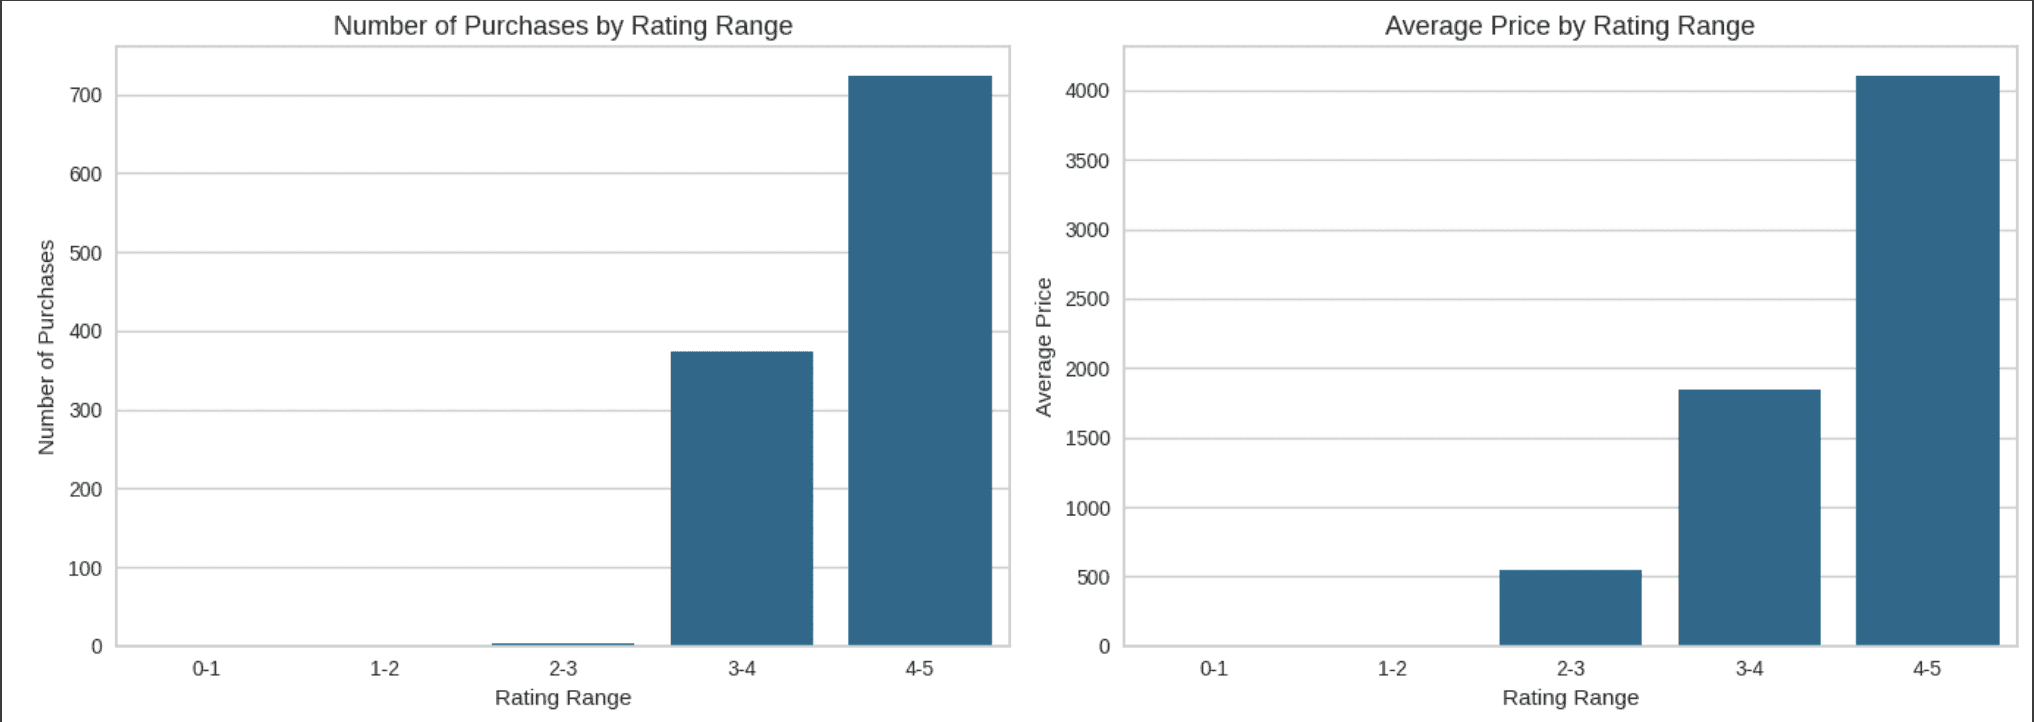
Number of Purchases and Average Pricing by Rating Range
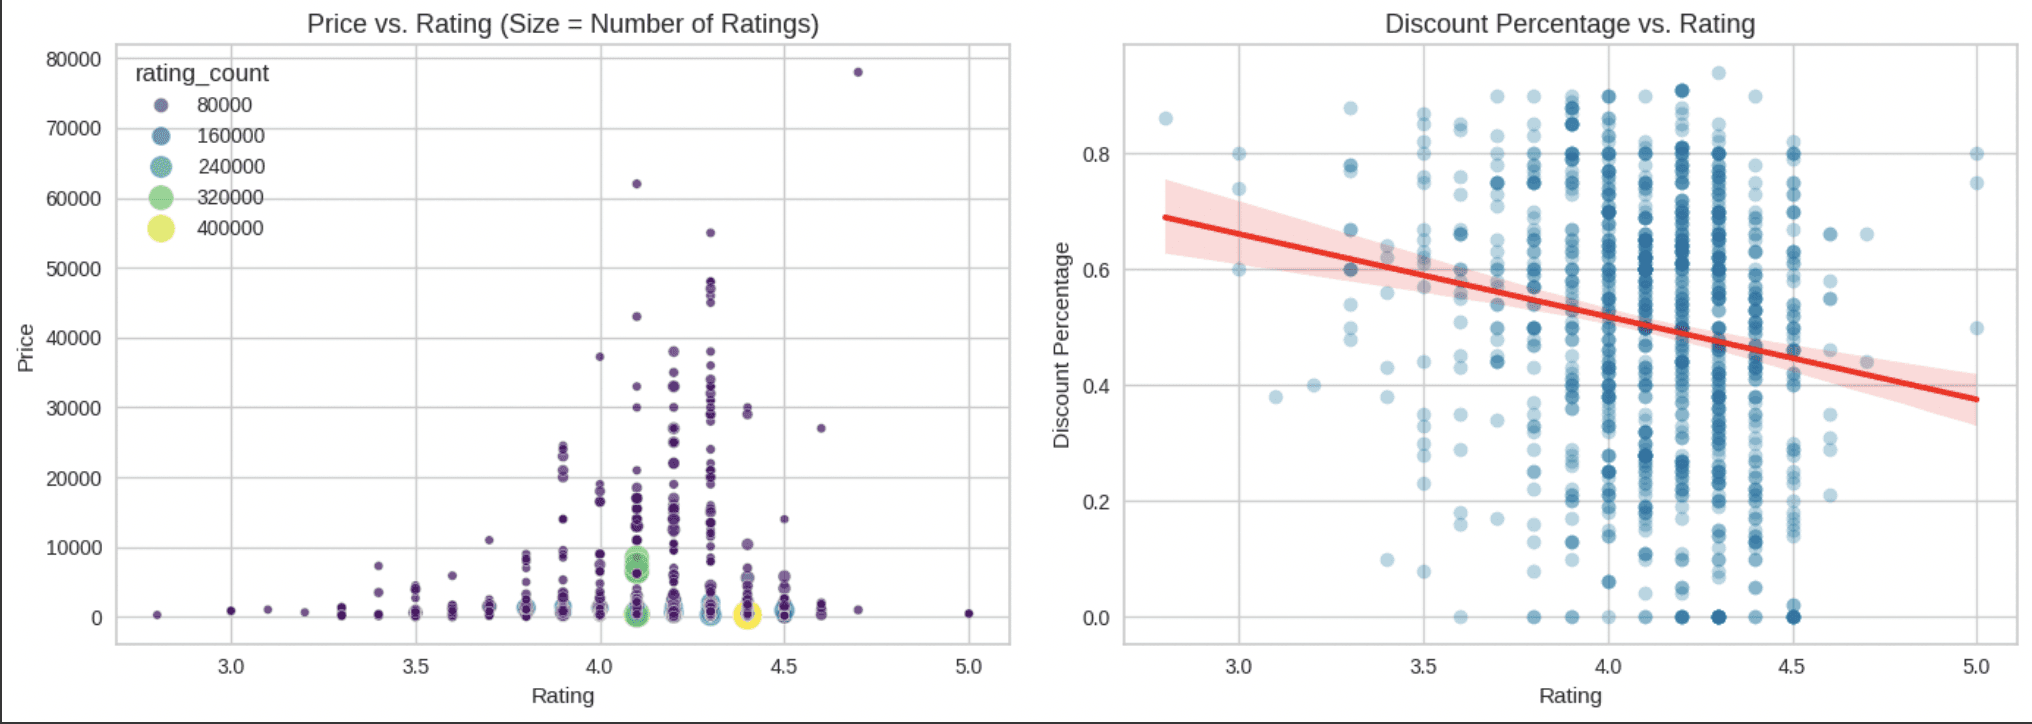
The Amount of Price compare to the Rating and The Distribution Percentage compare with the Rating
Followed by the Rating Bins in this I analyzed the relationship between rating and the number reviews that could show how well separated for each rating and well identified the outliers rating
Step 3
Insights and Recommendations
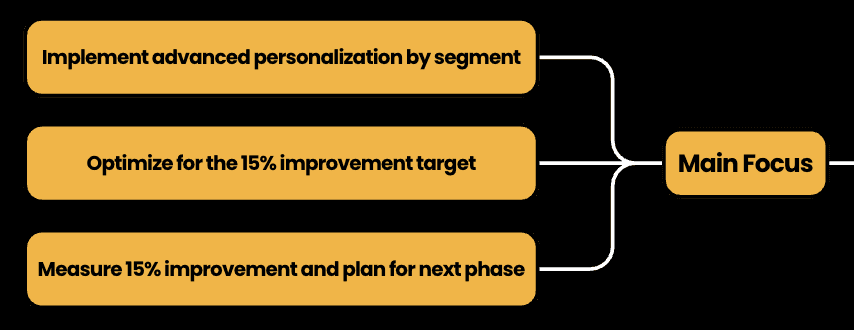
Through the Exploratory Data Analysis (EDA) and back to the problem statement and objective where I want proposed to enhance the marketing strategies through customer segmentation by the customer spending behaviour, in this i created 4 Phase to enhance Marketing Strategies :
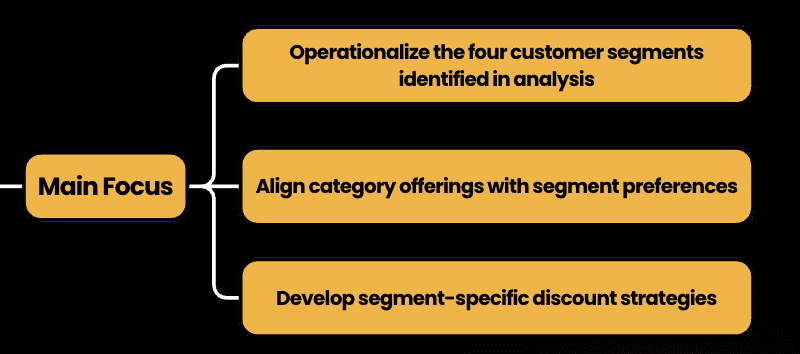
Foundation - Data Driven Segmentation
In the first phase, we transform raw customer data into a strategic asset by precisely defining four key customer segments: Balancers (32%), Validators (25%), Nobles (4%), and Bargainers (38%). This foundational stage focuses on creating a robust data infrastructure that enables accurate segment identification, implementing tracking systems, and establishing baseline performance metrics. The goal is to build a solid, data-driven framework that will support all subsequent marketing strategies.
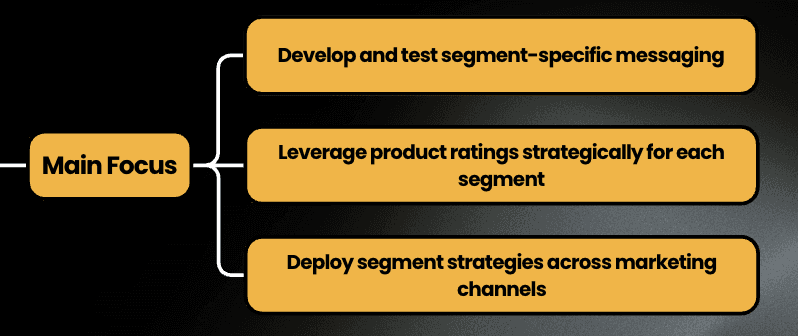
Activation - Personalized Engagement
Building upon the foundational segmentation, this phase brings customer insights to life through hyper-personalized marketing approaches. We develop tailored messaging and creative assets for each segment, implementing multi-channel strategies that speak directly to unique customer preferences. By conducting rigorous A/B testing and creating segment-specific engagement tactics, we aim to dramatically improve customer resonance and initial conversion rates.
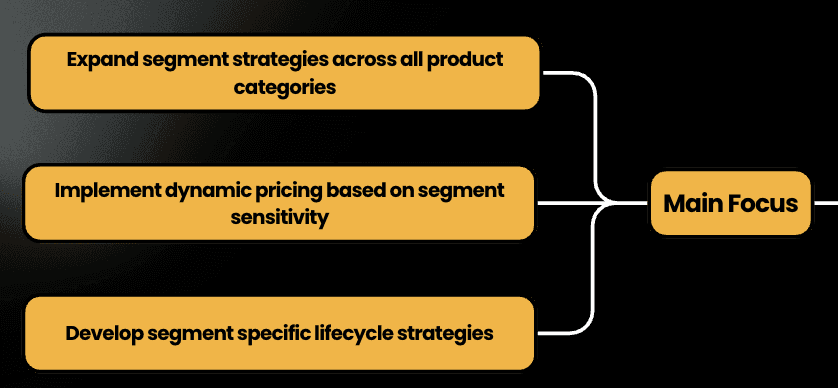
Scaling - Advanced Optimization
The scaling phase expands our segmentation strategy across all product categories and marketing channels. We dive deep into cross-category purchase patterns, develop sophisticated recommendation engines, and implement dynamic pricing strategies. This phase focuses on creating a comprehensive approach to customer lifecycle management, integrating insights across different segments and product lines to maximize marketing effectiveness and customer value.
Refinement - Precision Marketing
In the final phase, we leverage advanced AI-driven technologies to achieve unprecedented marketing precision. By developing predictive models, implementing real-time personalization engines, and conducting comprehensive performance analysis, we aim to fine-tune our targeting parameters. The ultimate objective is to achieve the targeted 15% improvement in marketing effectiveness, transforming our data-driven insights into a continuously evolving, highly adaptive marketing ecosystem.
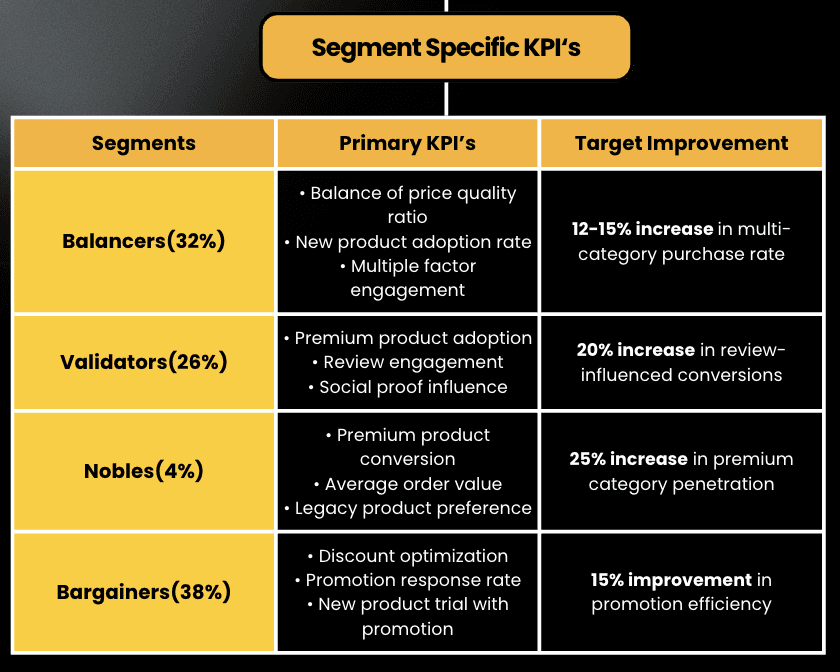
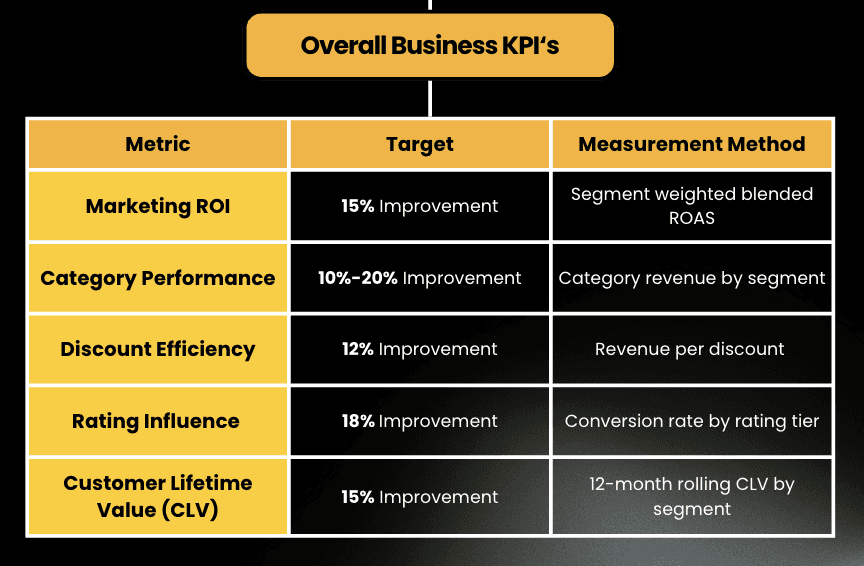
Last step to measure how everything will go as planned, I created the Key Performance Indicator to track for the specific segment KPI’s and the Overall Business KPI’s
Step 4
Interactive Dashboard - in Tableau
The dashboard represent all the result that i’ve done to analyze the customer segmentation, these analysis reveals four distinct customer clusters, each with unique characteristics
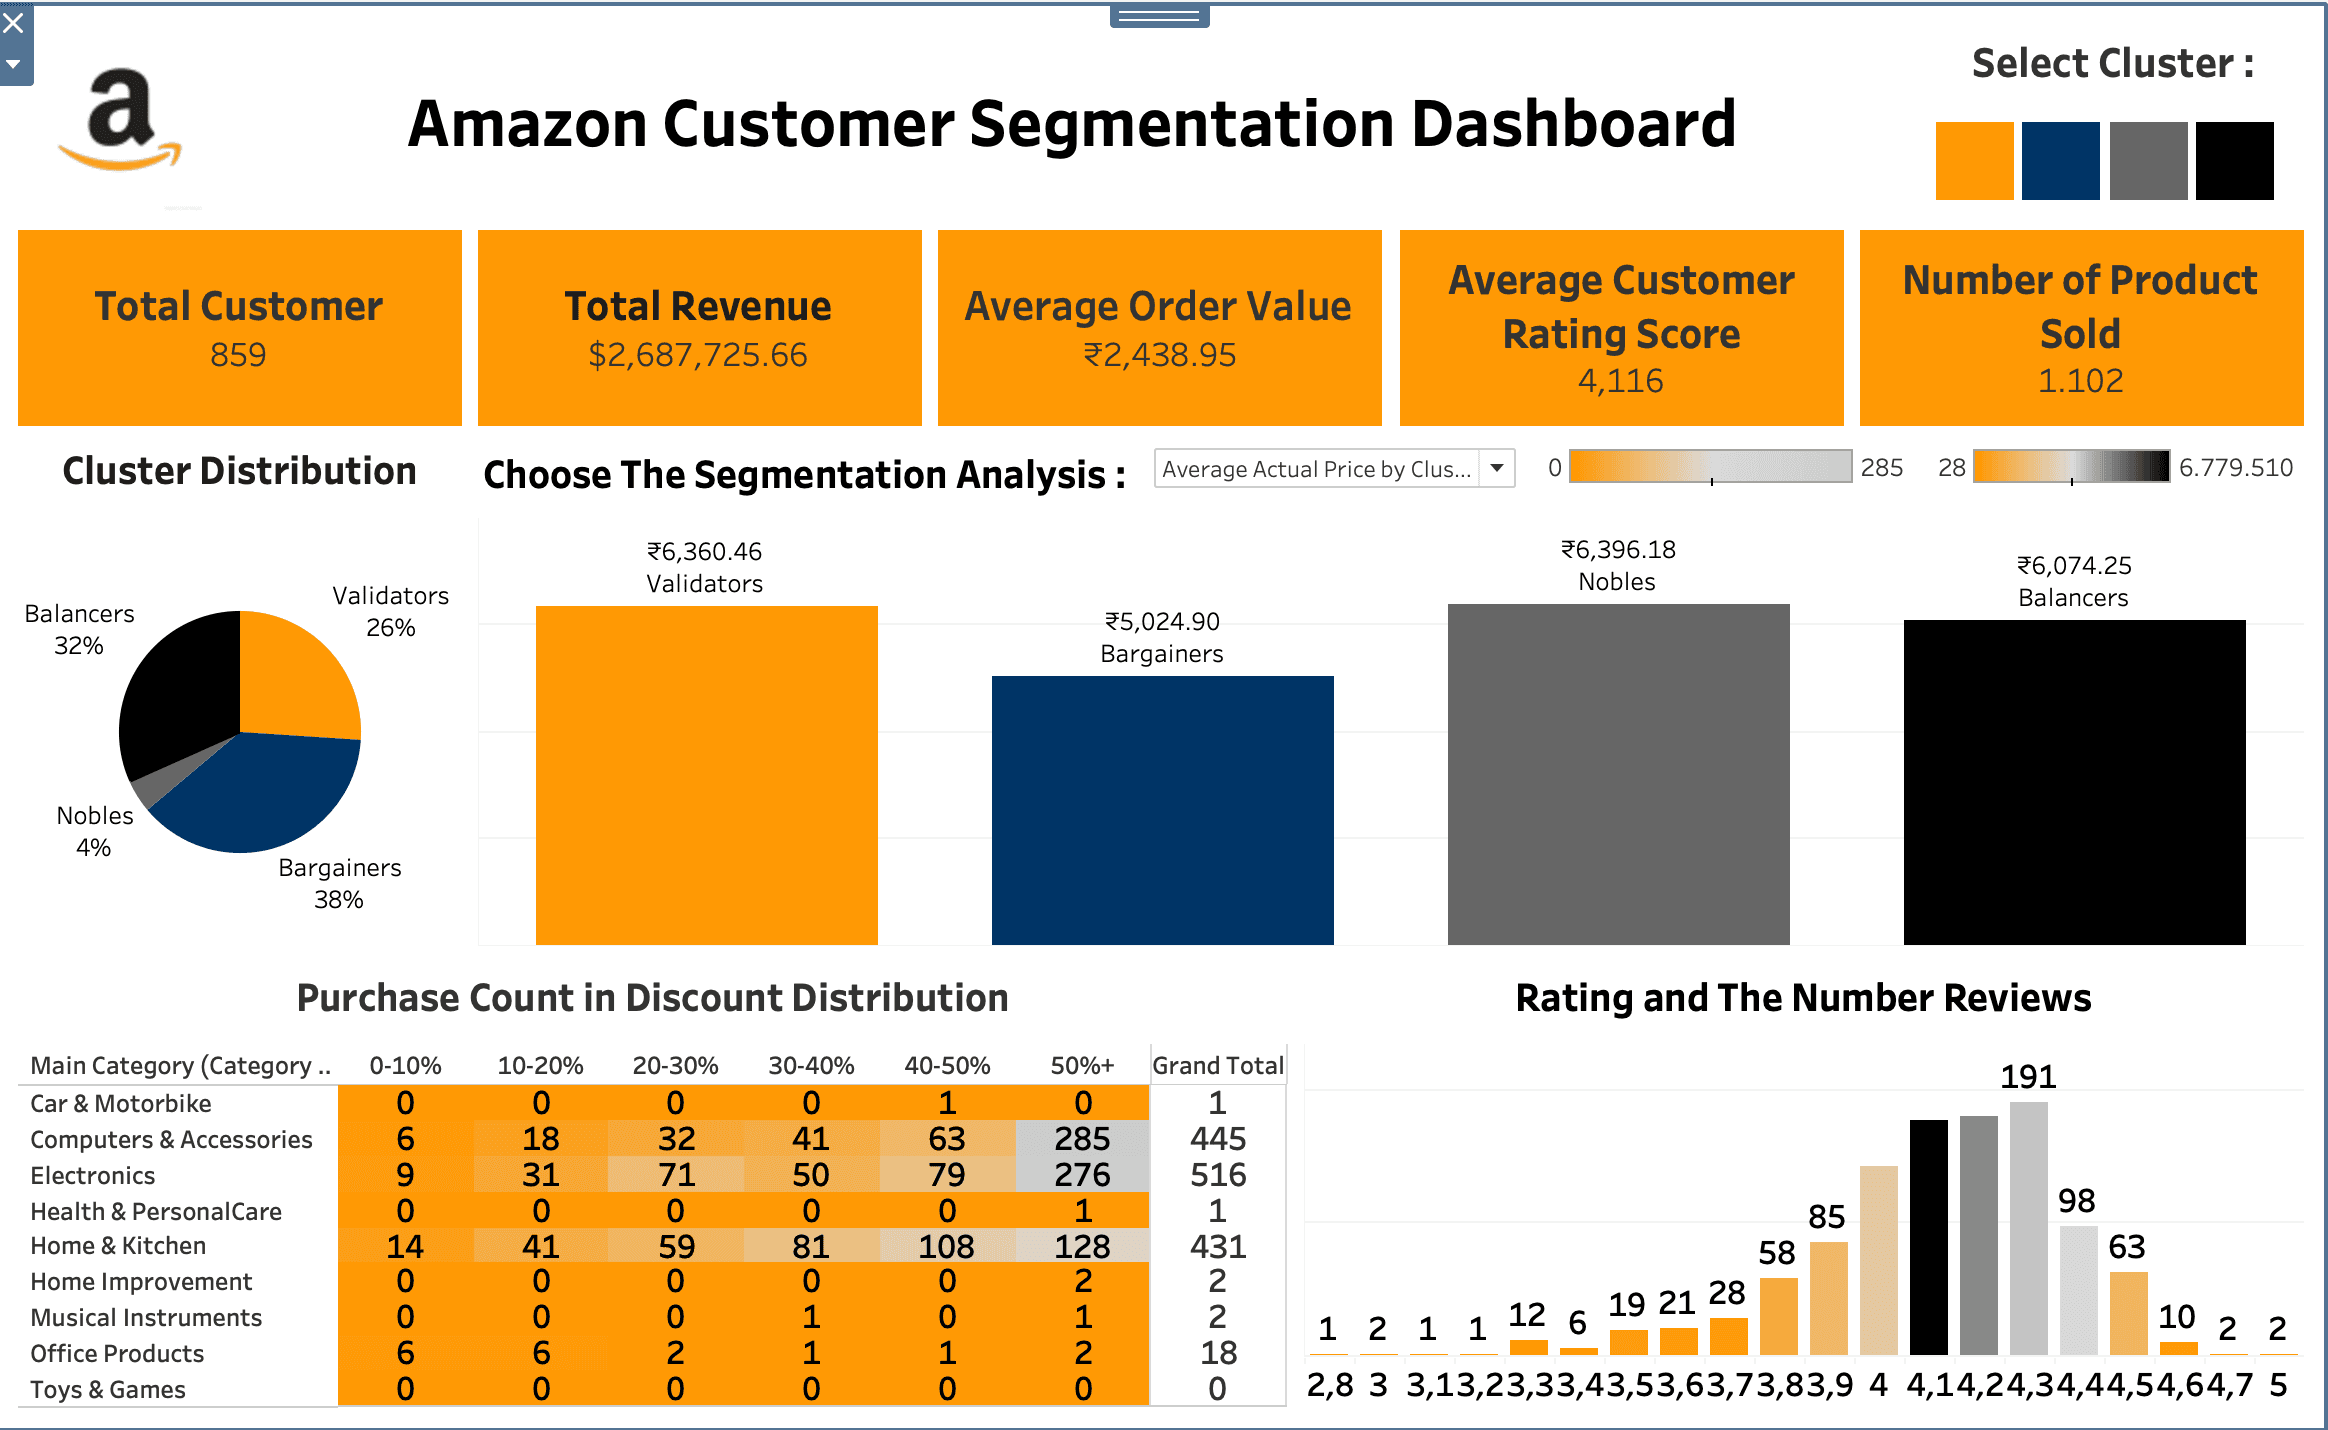
Key Components of The Dashboard
Top Section: Main KPIs
(5 Key Performance Indicators)Total Customer
Total Revenue
Average Order Value
Average Customer Rating Score
Number of Product Sold
Cluster Filtering (Top Right)
The colored buttons allow you to filter the entire dashboard by different customer segments.Orange = Validators
Black = Balancers
Gray = Nobles
Navy = Bargainers
Analysis Filtering Section (Center)
Shows the selected analysis type with a dropdown menu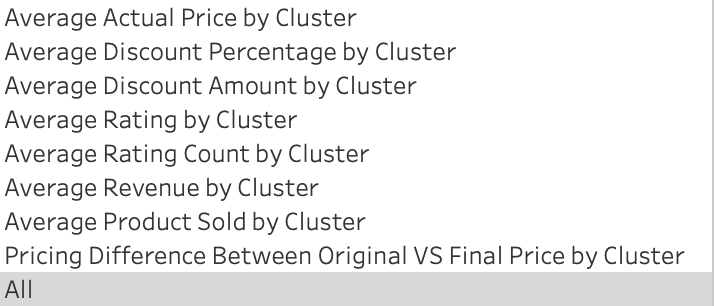
Cluster Distribution (Left Side)
This pie chart shows customer segmentation into 4 groupsBalancers (52%): Largest segment, likely balanced shoppers
Bargainers (38%): Price-sensitive customers
Validators (6%): Smaller segment, possibly careful purchasers
Nobles (4%): Premium customers, smallest but likely high-value
Rating and Number of Reviews Distribution (Bottom Right)
This histogram shows the distribution of customer ratings from 1-5 starsMost customers give ratings between 3-4 stars, The distribution appears relatively normal with a slight skew toward higher ratings, Peak appears around 4 stars with 98 reviews
Purchase Count in Discount Distribution (Bottom Left)
This table breaks down purchase behavior by product category and discount ranges (0-10%, 10-20%, etc.).