
Credit Product Revobank
Banking analytics project that leveraged machine learning to segment 12,559 customer records into distinct behavioral personas.
Client:
Revobank
Date:
June 27, 2025
Type:
Customer Segmentation
Role:
Data Analyst

About
This project was conducted as part of the RevoU Python module and aimed to sharpen my technical expertise in data cleansing, exploratory data analysis, and segmentation using clustering methods.
Key Deliverables :
the project’s primary focus was on customer segmentation using RFM and K-means methodologies. My role involved understanding business problem, extracting insights, categorizing customers based on distinct characteristics, overseeing behavior tendency, and customizing recommendation for each segments based on transaction trends.
Context
RevoBank is a European bank that offers credit card products to its customers. The bank aims to increase credit card usage among existing clients by analyzing customer behavior and sales performance.
My role in this part are part of the Performance Management (PM) team, that working with a dataset from the MIS team that contains 36 months of sales data. The goal is to create user personas and insights based on client activity to support credit card usage strategies.
Problem
Transaction Behavior Analysis: RevoBank wanted to understand how customers transacted during promotional vs. non-promotional periods.
Promotion Effectiveness: There was a need to compare credit card usage across different customer groups and validate the effectiveness of past promotions.
Targeted Strategy Development: The bank aimed to design cost-efficient, segmented promotional strategies that resonated with core user clusters
Objective
To analyze RevoBank credit card sales performance trends over the past three years and identify key growth patterns.
To develop user personas based on existing client data to understand customer behavior and segment characteristics.
To identify and prioritize business opportunities that will increase RevoBank credit card product usage among current customers.
Processes & Considerations
Step 1
Data Cleaning
Out of 12.558 rows of data, 72 of identical duplicate data are found and manage to deleted where it lead into a usage of 12.486 data or 99.2% from the original data are used.
Identified anomalies data that referred to the data dictionary caused :
Before | After | Process |
|---|---|---|
4 Account Activity Level | 3 Account Activity Level | Deletion because none information are support to impute or insert the data to others |
6 Customer Value Level | 5 Customer Value Level | Insert into other value level referring to the lower limit of a level |
Found out 735 missing values of data from the avg_sales_L36M that handled with imputing the data using mean imputation method (5.89% missing values doesn’t pass the low threshold of deletion)
In order to ensure data quality and reliability for the RevoBank credit card analysis, comprehensive data cleaning and preparation processes were implemented on the original dataset of 12,558 rows.
Step 2
Exploratory Data Analysis - Customer Segmentation
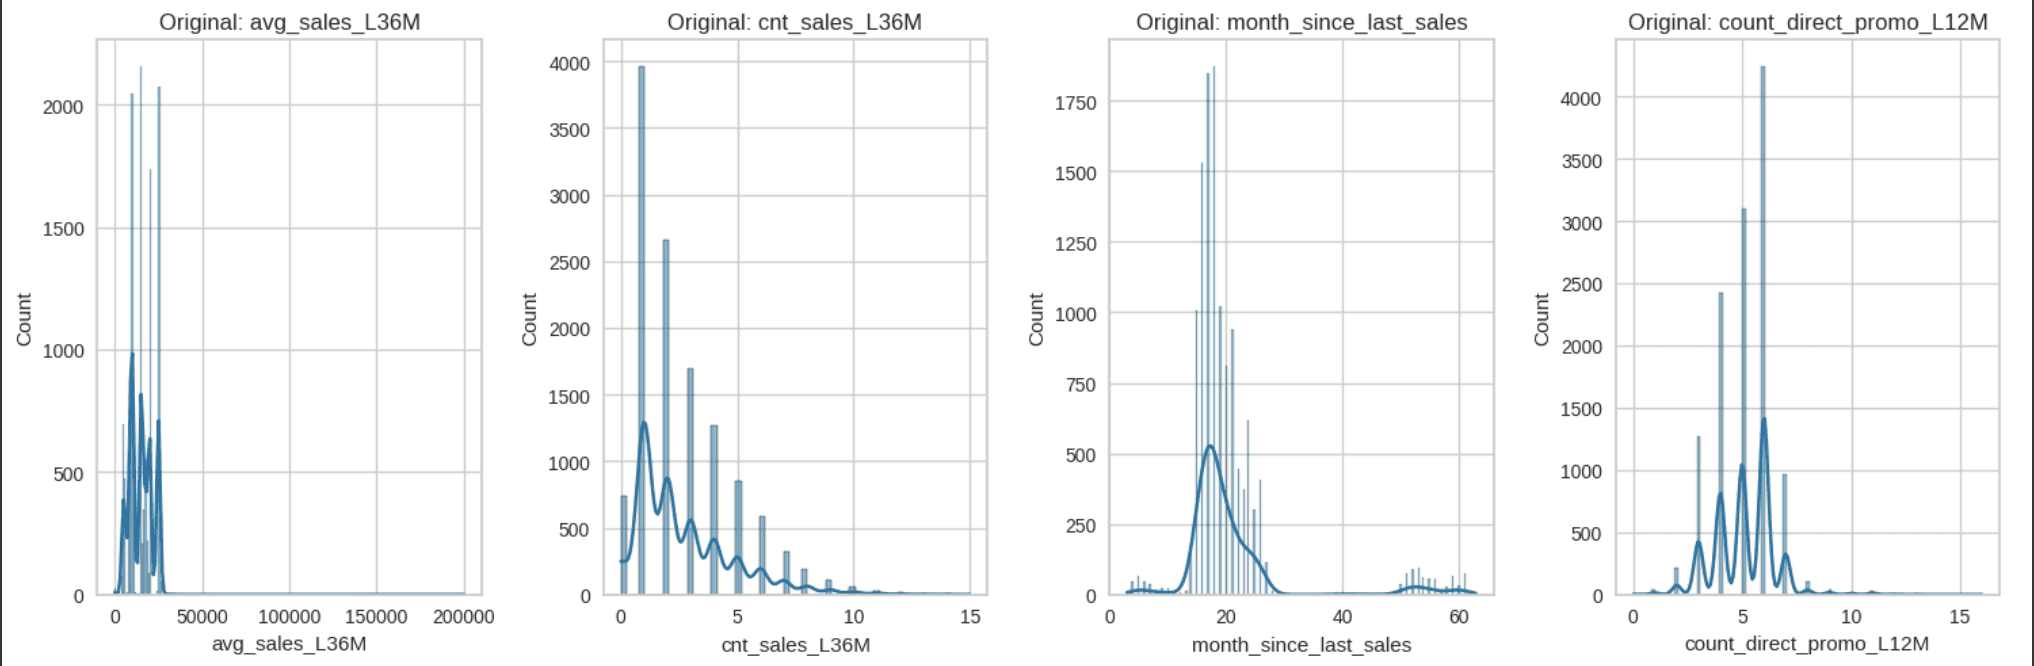
Setting the environment by initialize Key Credit Card Usage Metrics and the Potential Profit Calculation through this features :
Key Credit Card Usage Metrics | Potential Profit Calculation |
|---|---|
avg_sales_L36M | avg_sales_L36M |
cnt_sales_L36M | cnt_sales_L36M |
month_since_last_sales | |
count_direct_promo_L12M |
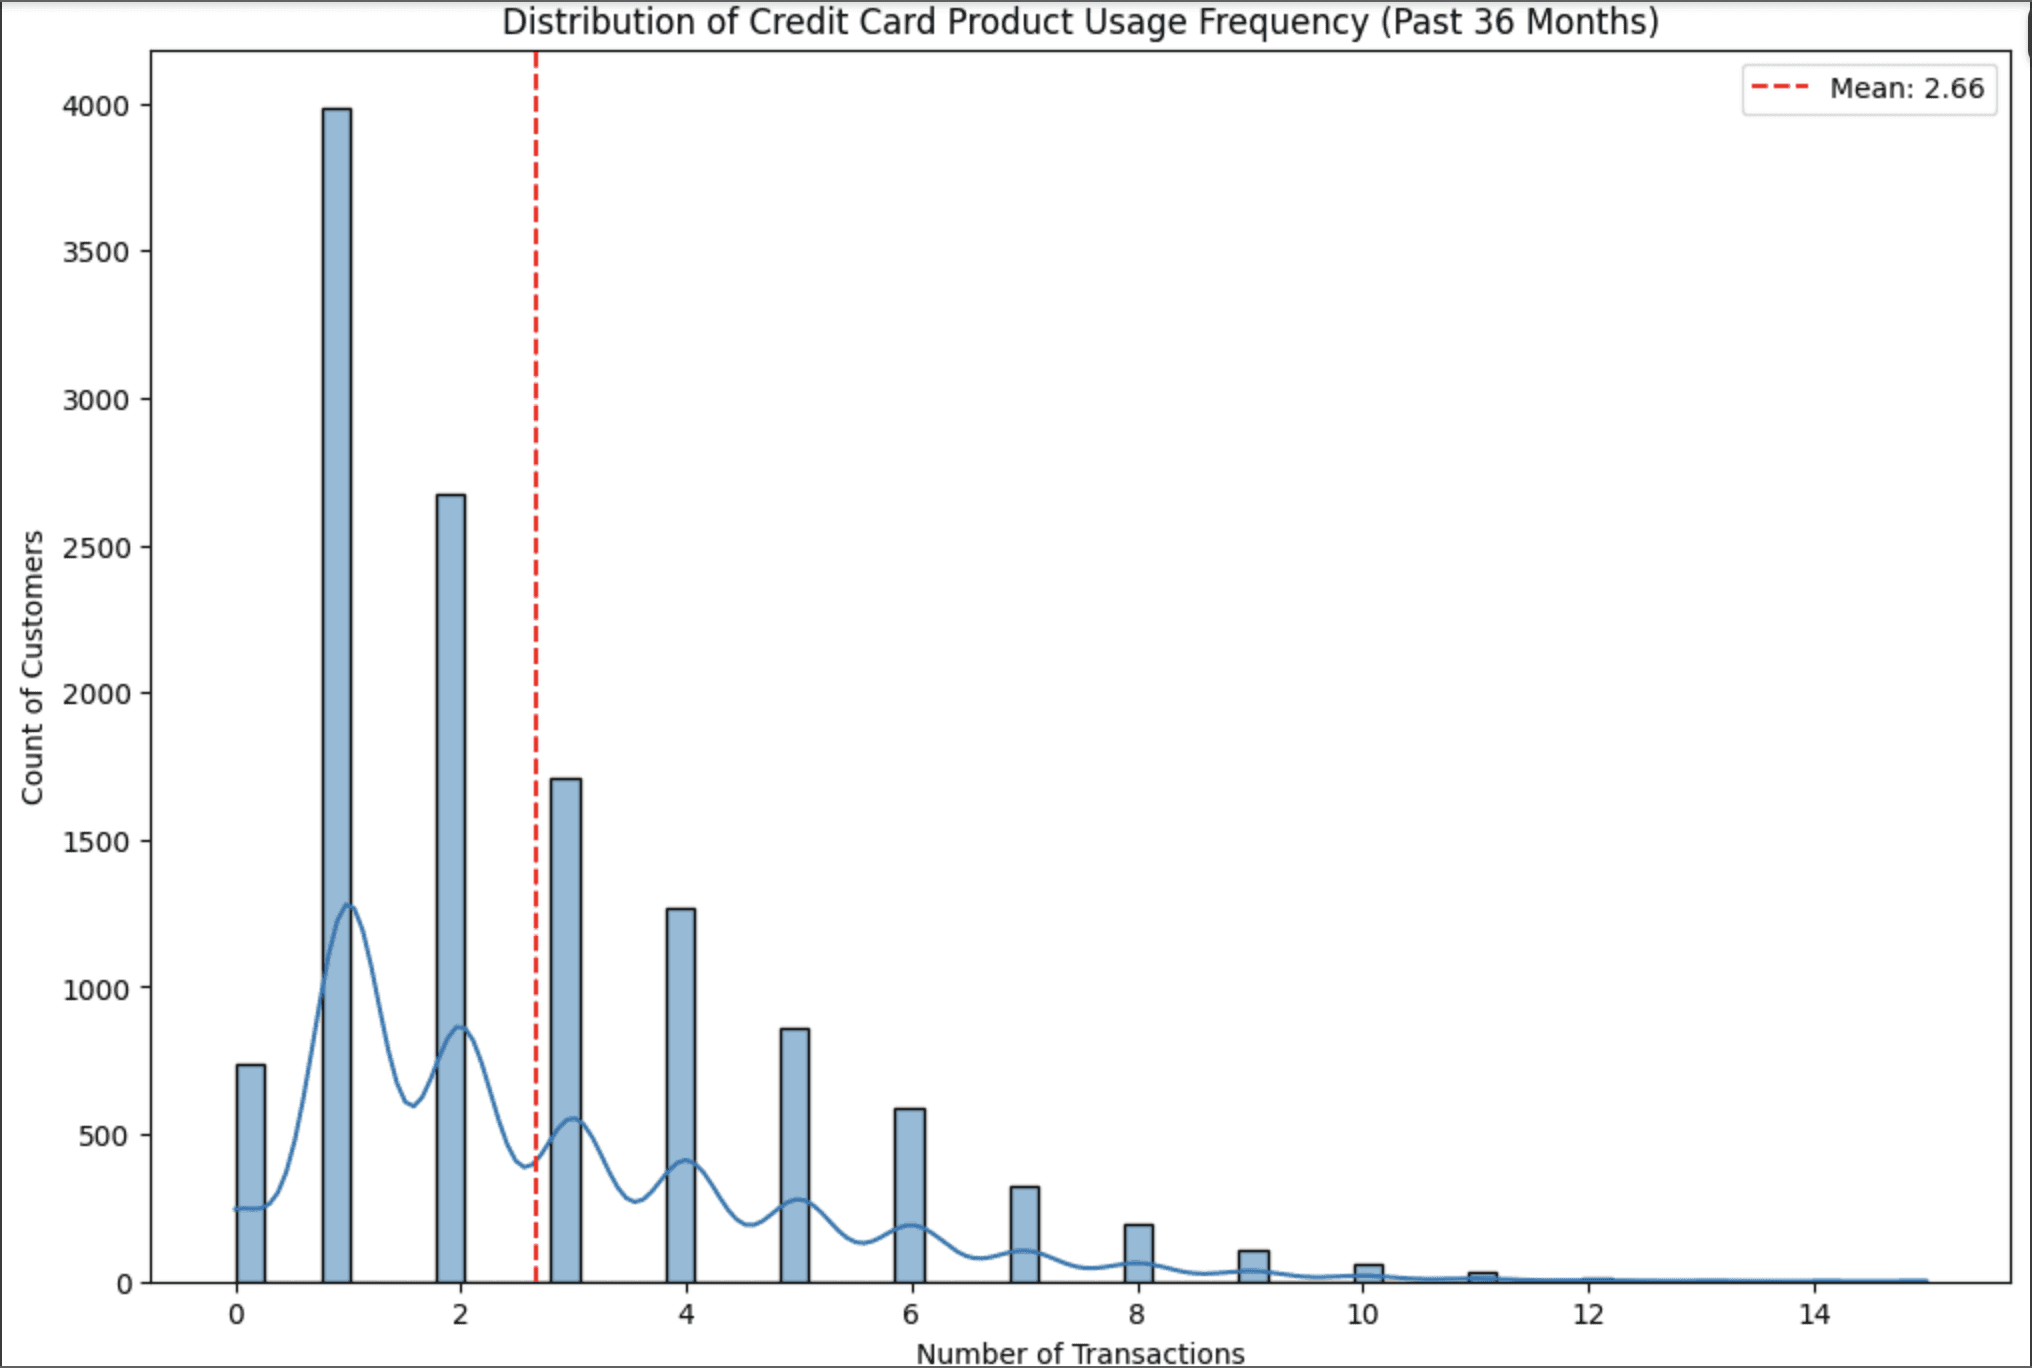
Examine the distribution of credit card usage over 36 months to know how’s the distribution of the usage for the credit card by immediately visualize the distribution
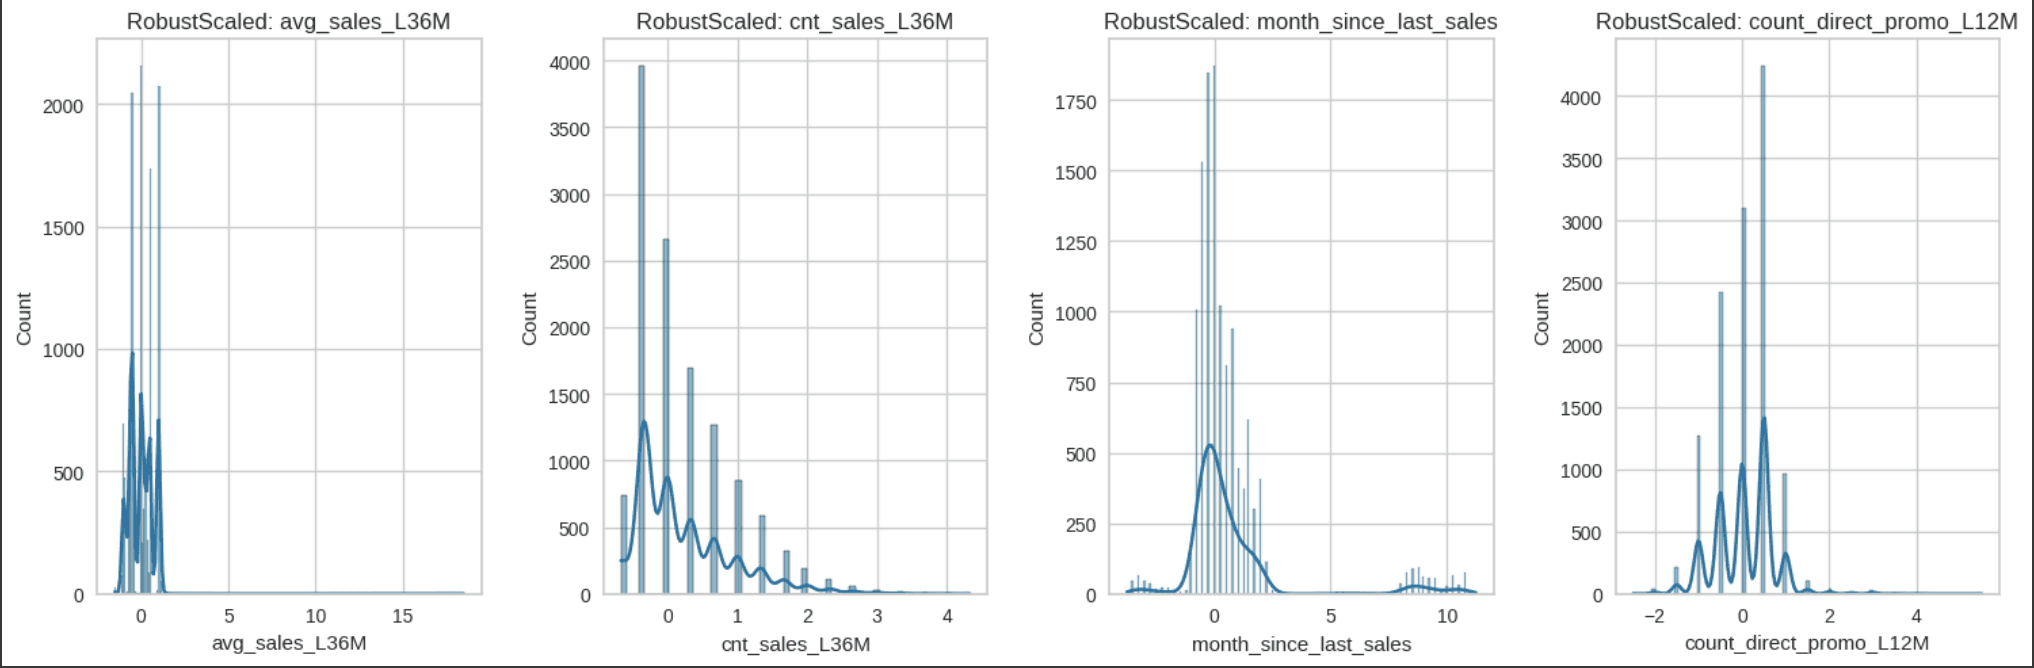
Identified that there are a lot of outliers in the data I pick Robust Scaler to scale the data by the features that already been selected that related to the Credit Card Product Usage because robust scaler uses medians and quantiles instead of means and standard deviations and that makes it more robust to the outliers
Implement K-Means Clustering Method (choosing K-Means Method rather than RFM because this is sales dataset where it could lead to an anomalies spread of data, and in this I want to identify by using a lot of features and K-Means can create as many segments as needed) for the credit card usage analysis
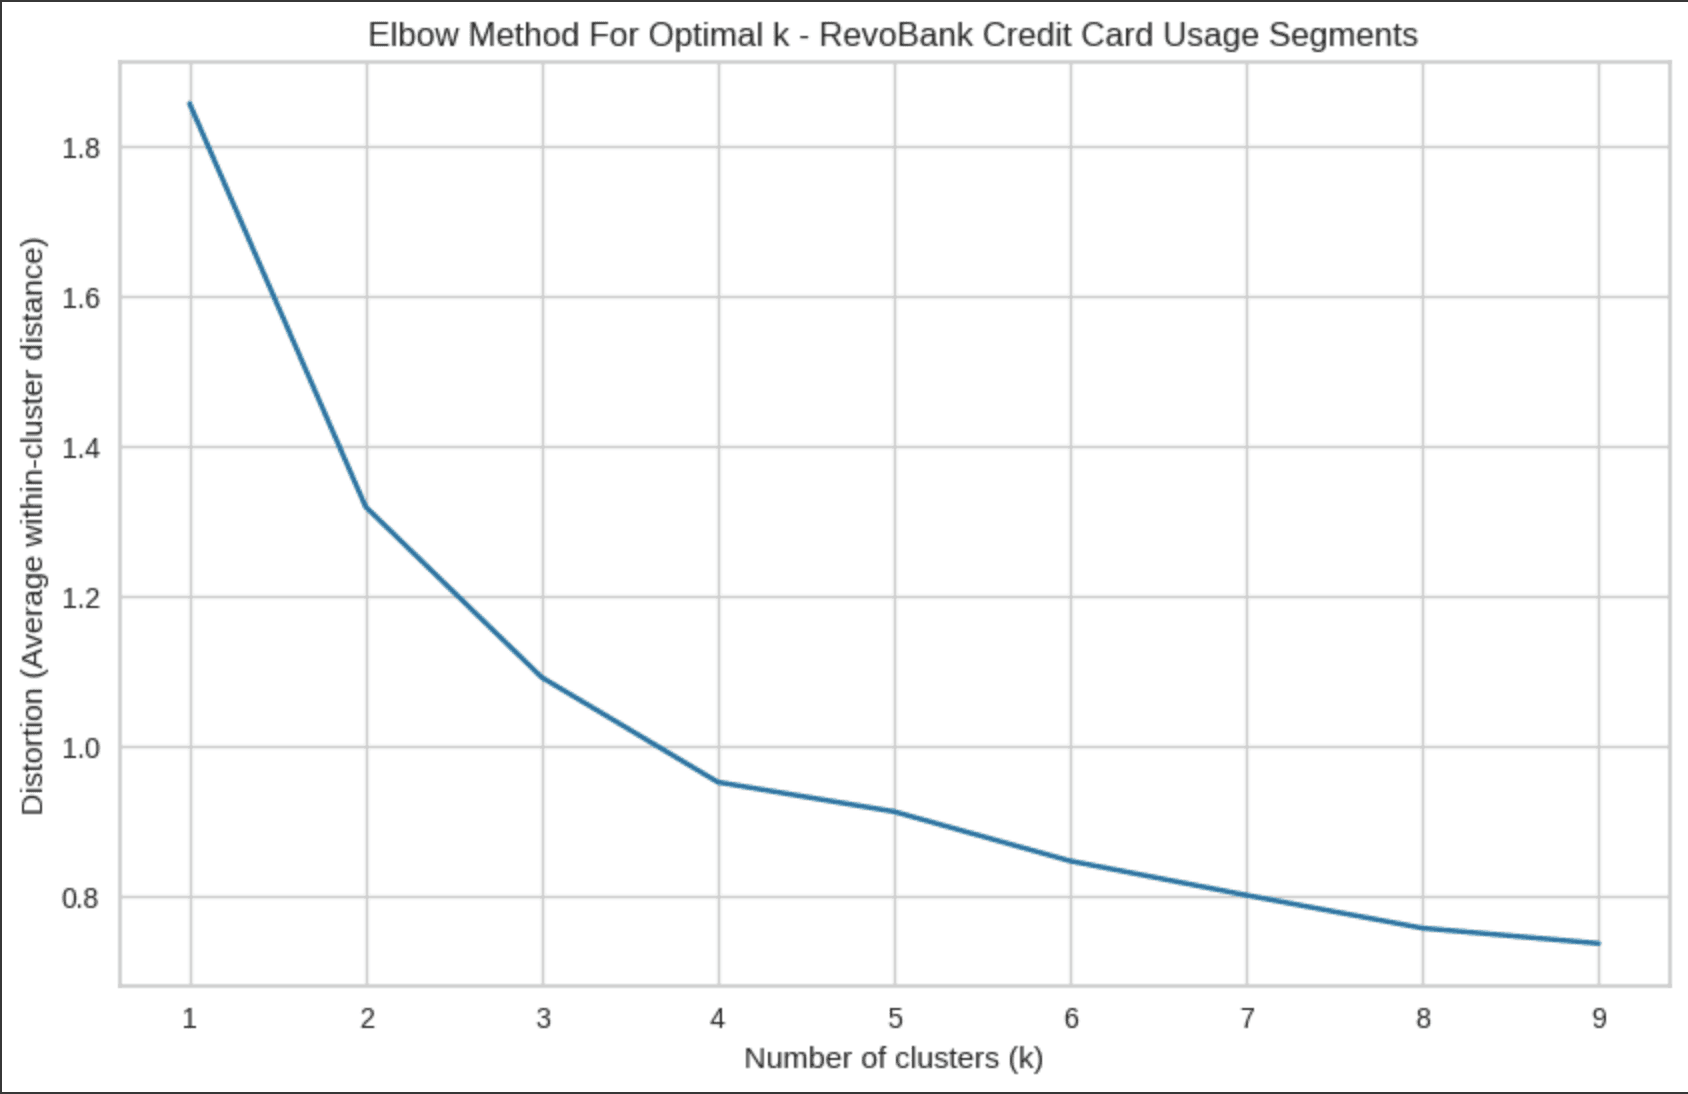
Confirm the K or Cluster number using the Elbow Method and Silhouette Method to support the usage of cluster number, Reasoning :
Why Elbow Method : To identify the optimal number of clusters by evaluating the Within-Cluster Sum of Squares (WCSS), the measure of how tightly grouped the data points are within each cluster.
Why Silhouette Method : To evaluate how well-separated and well-defined the clusters are not just compact, but also distinct from one another.
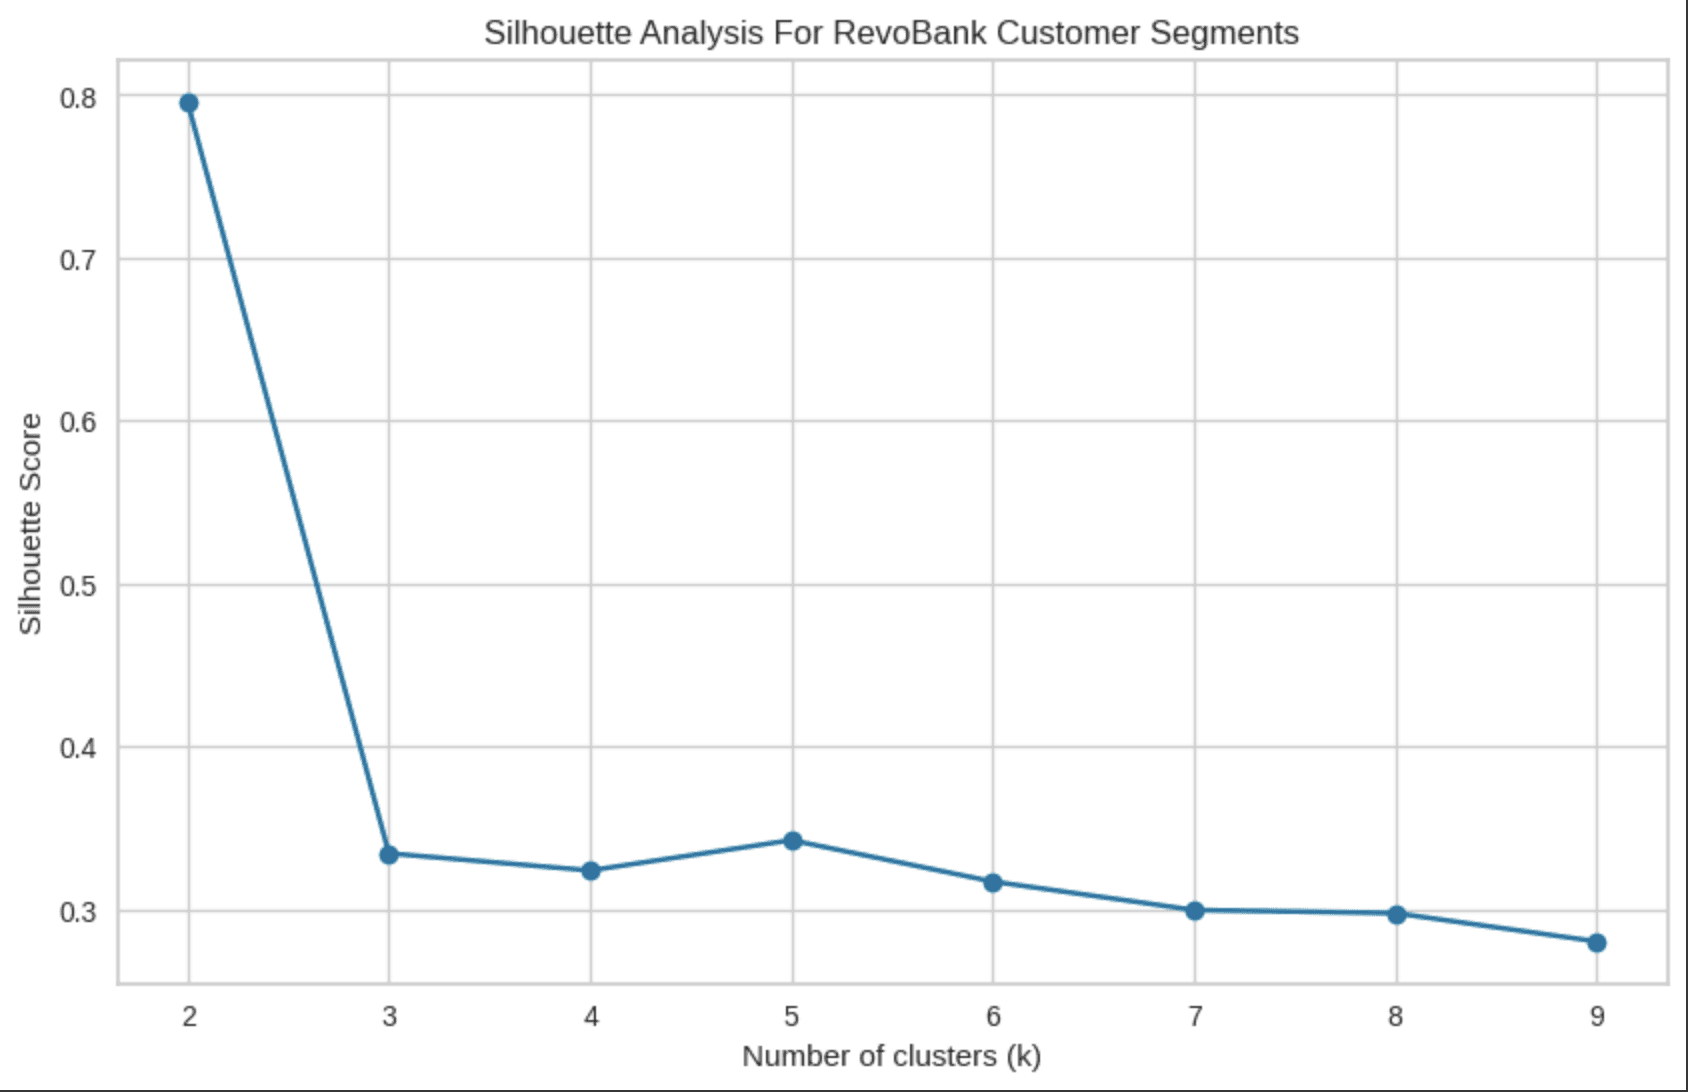
From the Elbow and Silhouette Method we can know that K=4 or using 4 Cluster are the best for the segmentation where 4 cluster have a strong in several aspect just like :
Elbow Point: It's precisely where the marginal benefit of additional clusters drops dramatically
Balanced Trade-off: While not the absolute highest silhouette score, it provides reasonable cluster quality without over-segmentation
Business Practicality: Four segments are manageable for marketing strategies and customer relationship management
Natural Structure: The data appears to have inherent groupings that align well with four clusters
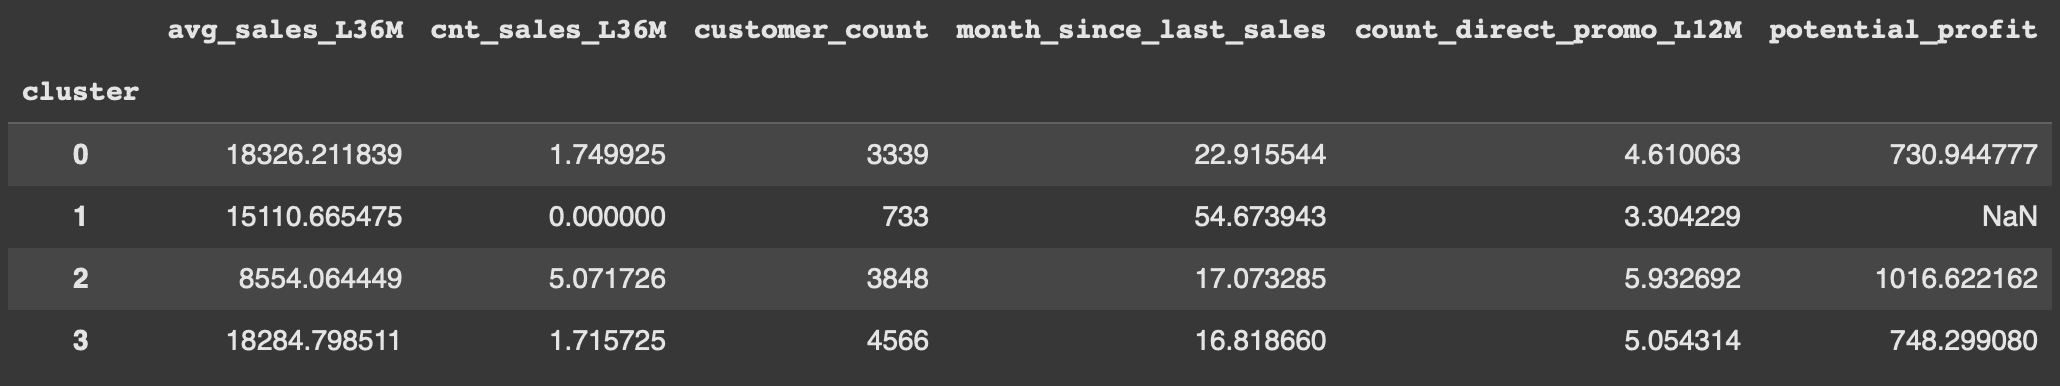
By choosing K=4 value as the cluster, we can identify the valuable credit card user segments by grouping the key metrics with each cluster
Step 3
Data Visualization - By Key Metrics
By identifying the key metrics of Credit Card Usage there are several points that we need to analyze based on each cluster :
Average Sales Per Client
(Understanding revenue potential and customer value)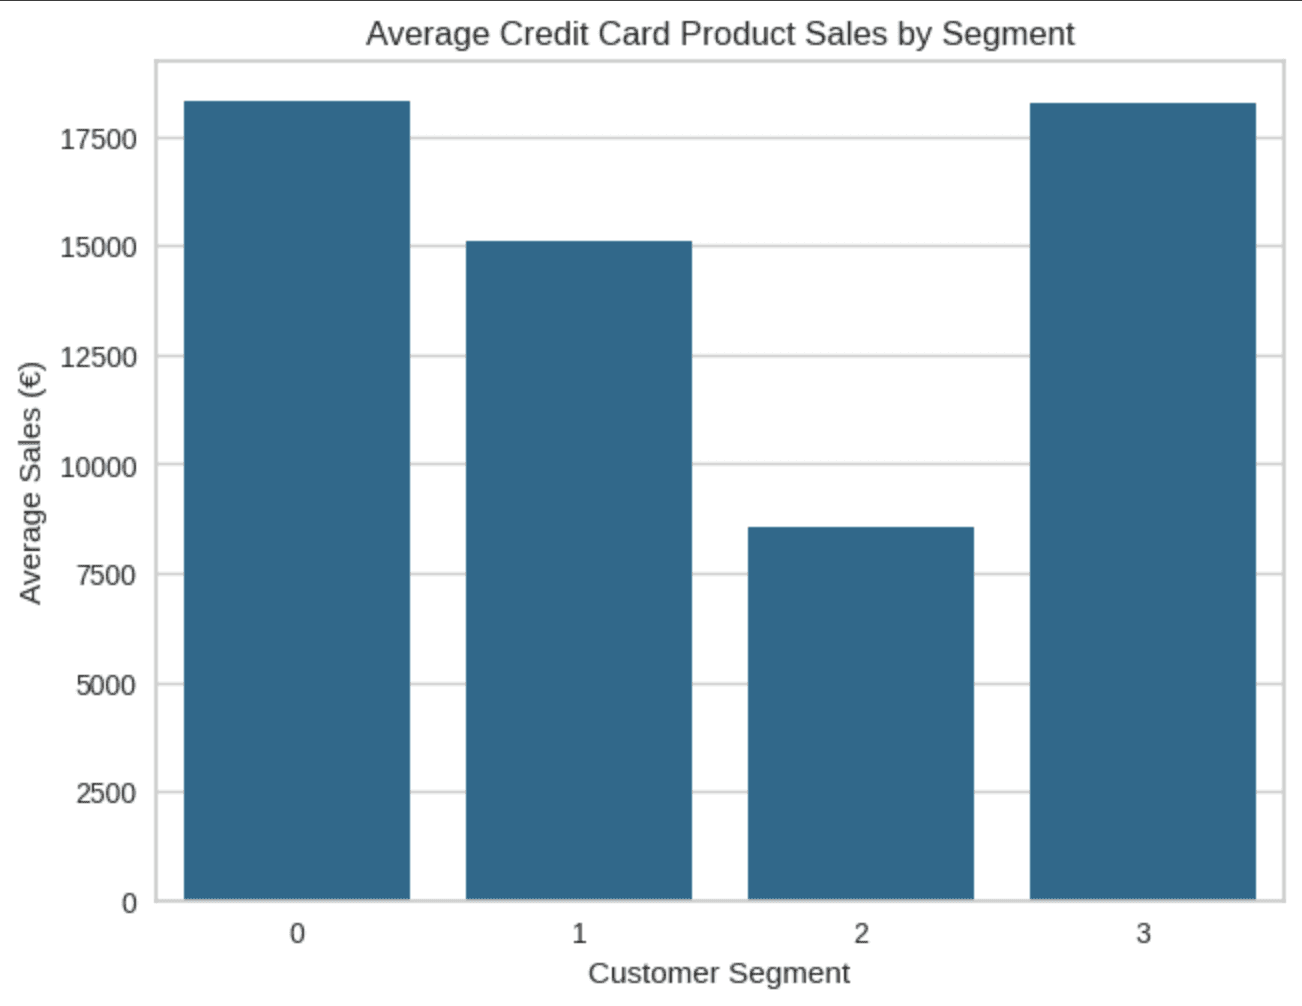
Average Transaction Frequency
(Understanding customer engagement patterns and loyalty)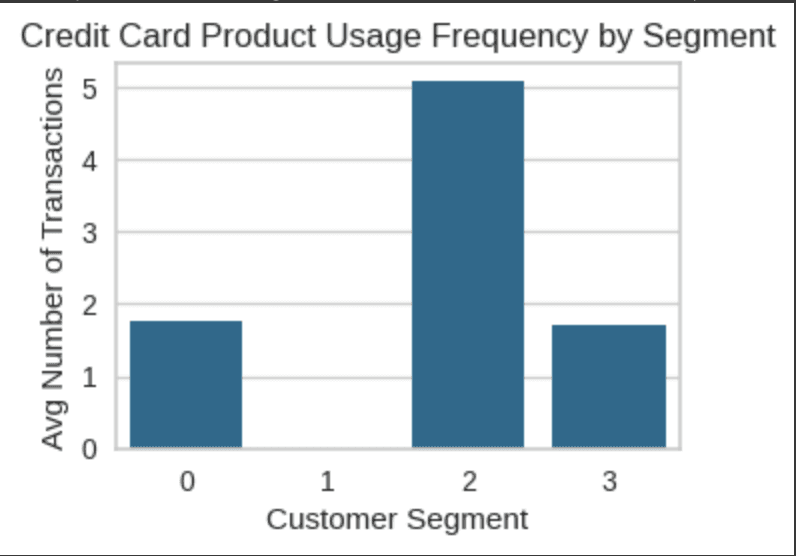
Total Profit by Cluster Metrics
(Understanding actual business value and ROI)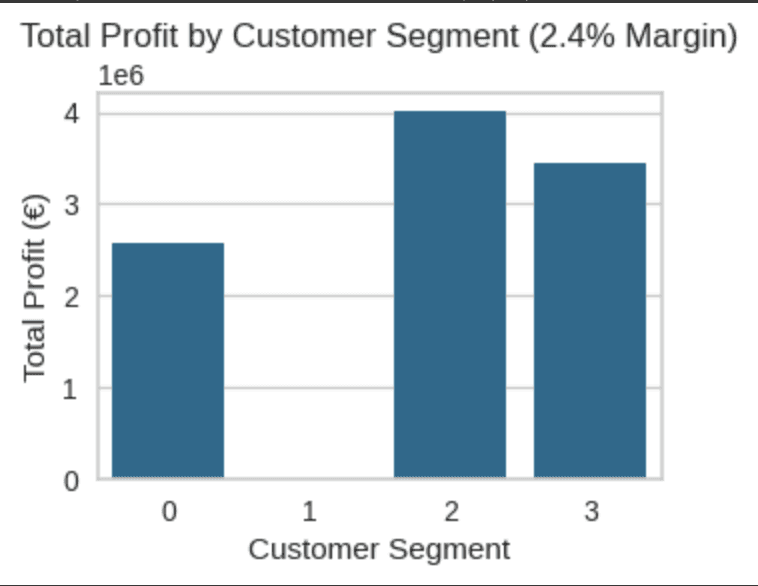
Active and Inactive Proportion Metrics
(Understanding segment health and engagement levels)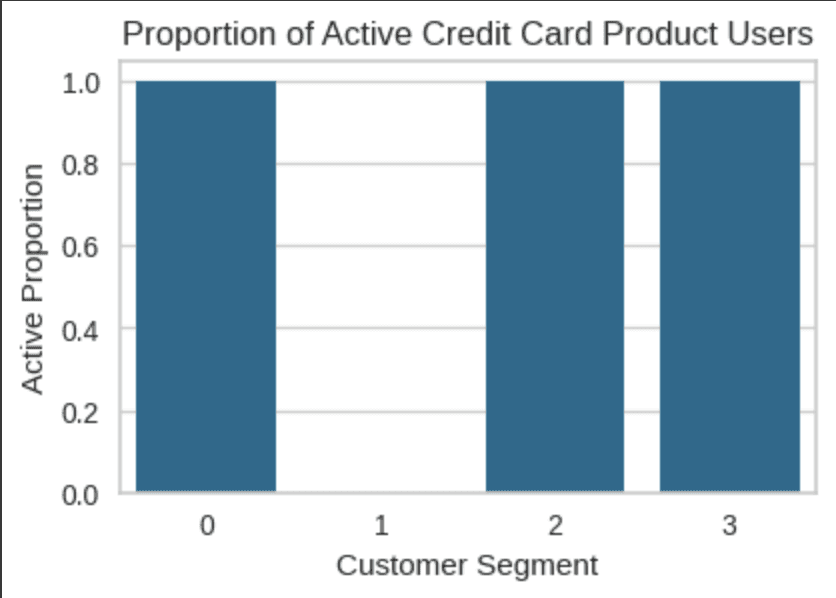
Step 4
Identify Business Opportunities
With all the output we can identify the user persona for each segments
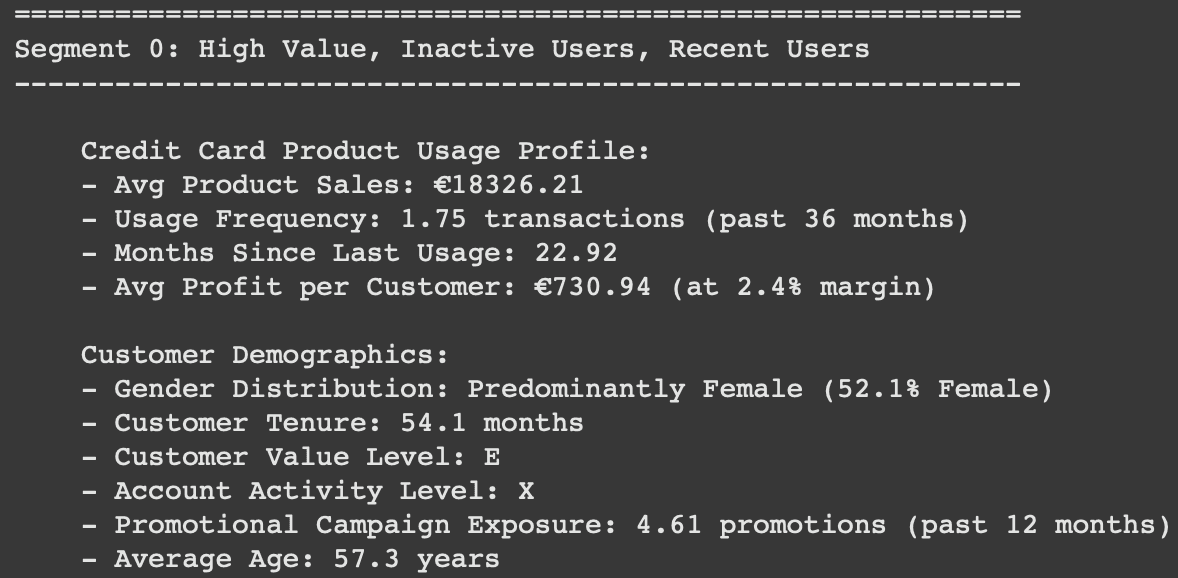
Segment 0 :
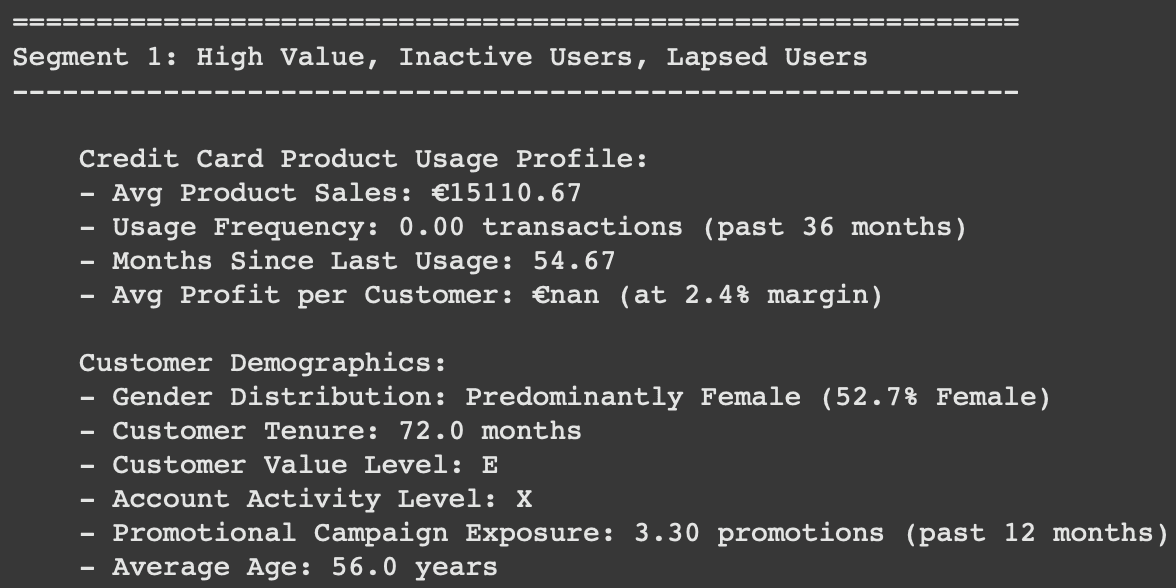
Segment 1 :
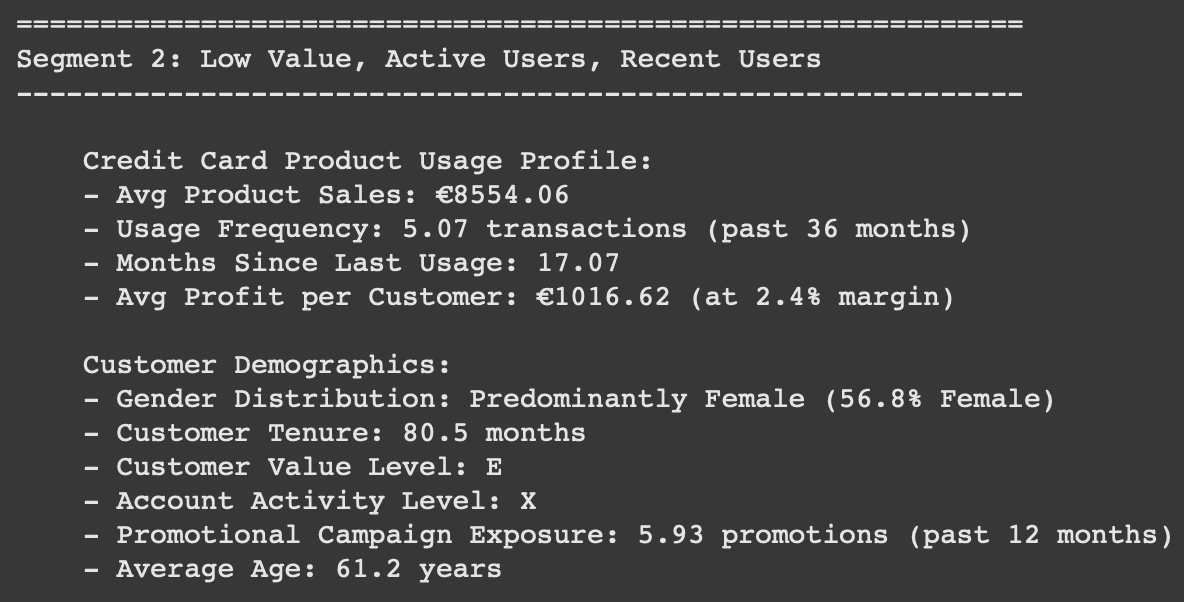
Segment 2 :
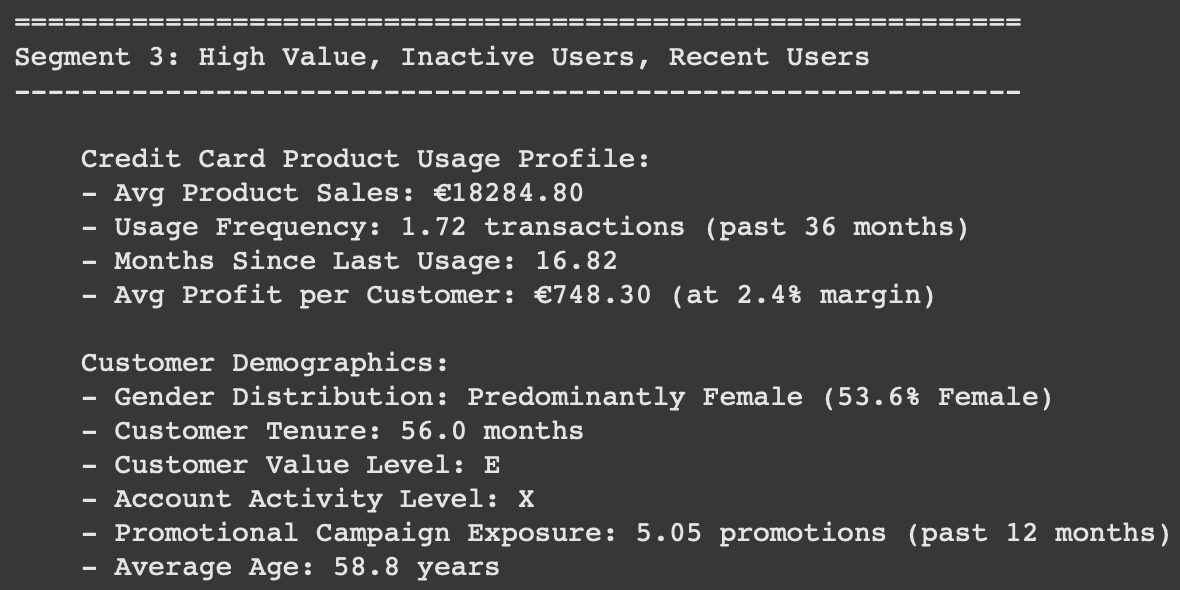
Segment 3 :
Insights and Recommendations
For Each Segments
User Segment 0
Maintain standard credit product communication
Include in general credit promotional campaigns
Monitor for signals of increased credit usage potential
Provide basic financial education on credit product benefits
Implement cost-effective service model for this segment
User Segment 1
Create "win-back" campaigns with special credit product incentives
Conduct surveys to understand barriers to credit product usage
Simplify credit application and usage processes
Offer "welcome back" bonuses for first new credit transaction
Develop streamlined credit products for inactive customers
User Segment 2
Implement tiered rewards based on credit transaction value
Provide financial education on premium credit products and their benefits
Create value-added service bundles around core credit products
Develop upgrade paths to higher-tier credit options
Use targeted marketing to showcase premium credit product benefits
User Segment 3
Create transaction-based incentives focused on credit products
Implement "milestone" bonuses for reaching credit usage targets
Develop mobile notifications for unused credit benefits
Launch targeted campaigns highlighting the benefits of regular credit product usage
Consider temporary rate improvements for increasing usage frequency