Q-Commerce Stock Plan
Developed a time-series forecasting model using the Holt-Winters method to predict short-term demand across five hubs with weekly and monthly granularity. Conducted pattern recognition to identify seasonality spikes, measured model accuracy with MAE, MSE, and MAPE, and designed a tier-based inventory strategy that reduced overstock risks and improved stock availability
Client:
Qcommerce
Date:
January 12, 2025
Type:
Forecasting
Role:
Data Analyst

About
This project were intended of my continuous learning at Revou Next, serving as the Data Exploration Sprint Project (DES). I was given the authority to choose my preferred method and dataset, understand the context with an intention of using Forecasting method as the Exploratory Data Analysis (EDA) and give actionable recommendations for the Quick Commerce problem and business objective. I handled to end-to-end data analysis process, which defining the project scope, establishing the analysis approach, contributing to the data analysis, and creating data visualizations.
Project Focuses
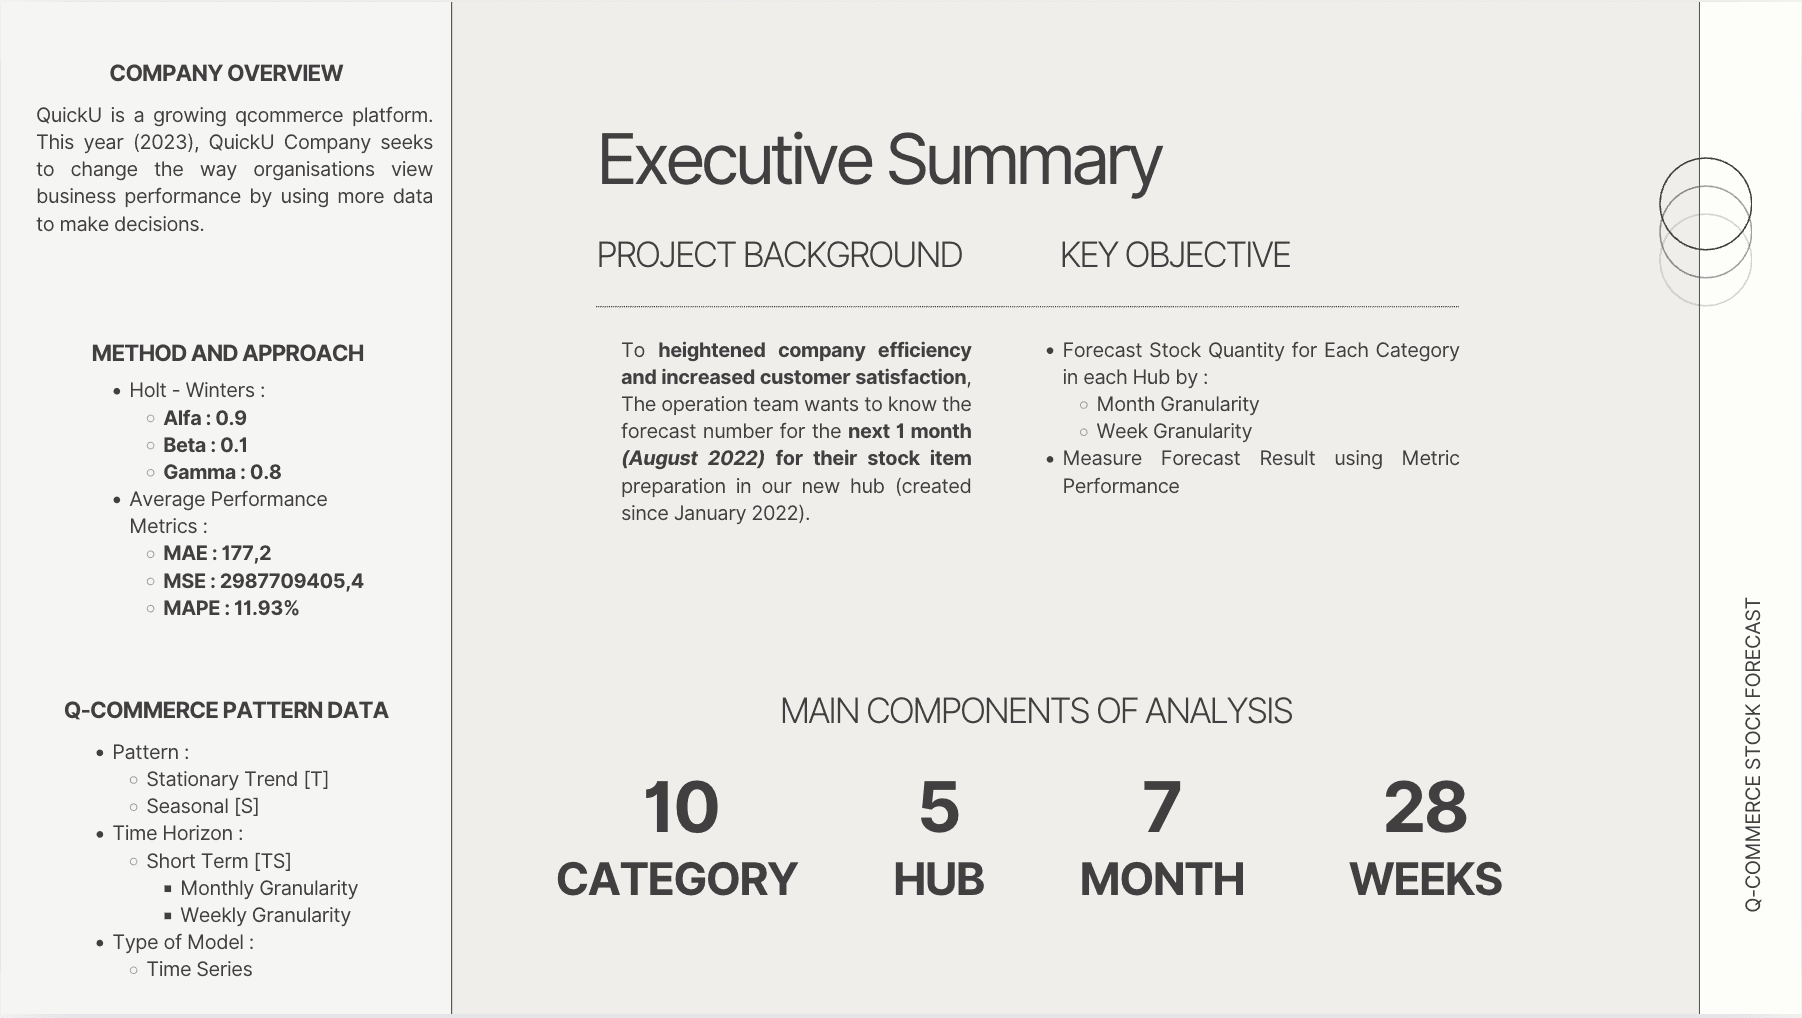
Analyzing 7 months of transactional data across 5 hubs and 10 categories to detect seasonal and trend patterns and build a forecasting model (HoltWinters) to forecast number their stock item preparation in the new hub by each category for August 2022
Problem Statement
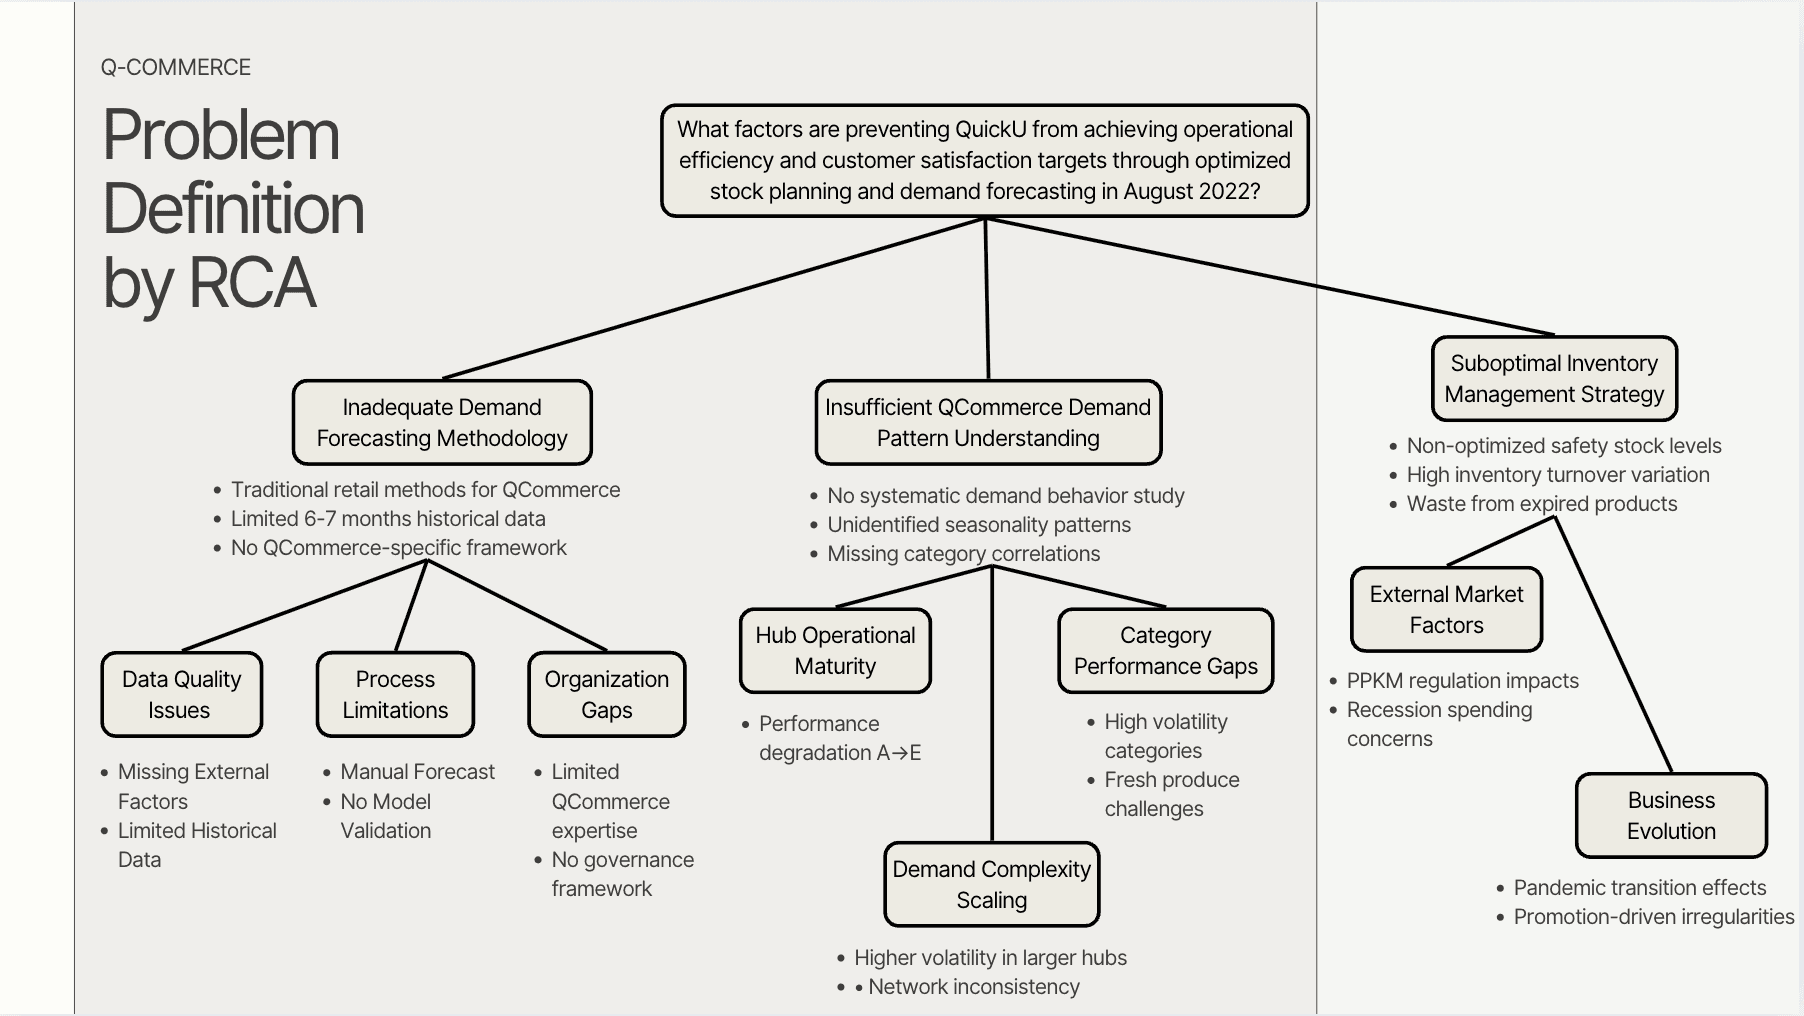
What factors are preventing QuickU from achieving operational efficiency and customer satisfaction targets through optimized stock planning and demand forecasting in August 2022?
Key Deliverables
Forecast Results – Hub- and category-level predictions for Aug 2022.
Performance Metrics – MAE, MSE, MAPE across hubs.
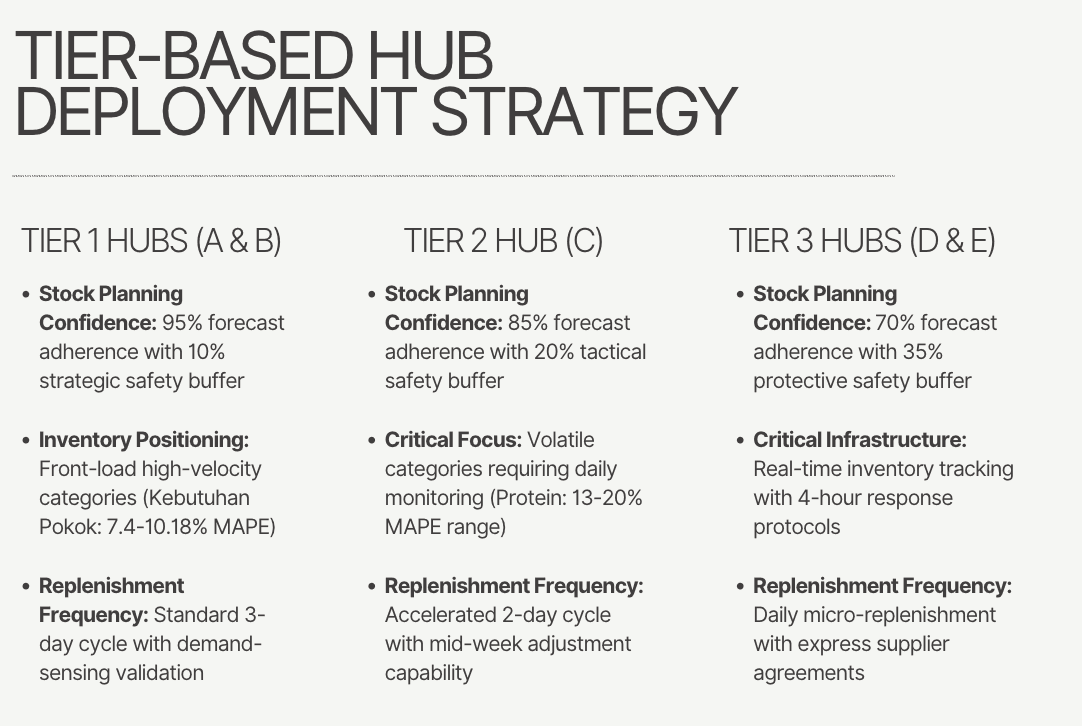
Hub Tiering Strategy – Classification of hubs into Excellence, Optimization, and Intensive Improvement tiers.
Safety Stock Recommendations – Forecast error-based buffer stock allocation.
Strategic Recommendations – Short-medium-and long-term improvements.
Essential Link
Context
QuickU, established in 2019, is scaling rapidly in Indonesia’s Q-Commerce sector. Its business model promises ultra-fast delivery with high product availability, requiring precise inventory planning. The dataset analyzed covers 120,000+ transactions across multiple hubs and categories, reflecting diverse customer behaviors, promotion-driven spikes, and pandemic-related disruptions. This complexity demanded an advanced forecasting approach tailored to Q-Commerce volatility.
Business Environment
Fast-moving Q-Commerce market, where fulfillment speed and product availability define competitiveness.
Diverse product categories (fresh produce, frozen goods, daily essentials) with varying demand volatility.
External influences (COVID-19 regulations, Ramadan seasonality, recession fears) driving irregular demand.
Problem - Root Cause Analysis (MECE)
QuickU needs a demand forecasting and inventory optimization system that enhances operational efficiency, improves stock availability for customers, and supports sustainable business growth in the competitive Q-Commerce market
from business problem breakdown we could see the possible recommendations how’s the business impact
Business Impact
Customer dissatisfaction from stockouts & delivery delays.
Lost revenue due to cancelled/failed orders.
Excess costs from overstocking and product waste.
Strategic risk: inability to sustain service standards in new hubs.
Objective
Deliver an accurate 1-month demand forecast (Aug 2022) with <12% MAPE for all hubs, enabling QuickU to increase order fullfillment to >98%, reduce stockouts to <2%, and optimize inventory costs by 10–15% within Q3 2022.
Processes and Considerations
Step 1
Data Cleaning
Column that I used for this project are
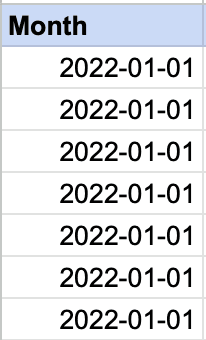
The data that provided were already cleaned, but the date format wasn’t in month format so i changed the date format from yyyy/mm/dd into month name
Before Format Changed
After Format Changed
Identified that there are no null or missing values in each of the column so, in the data cleaning process I managed to changed the date format only
Step 2
Exploratory Data Analysis - Forecasting Holt-Winters Triple Exponential Smoothing
Decided to Identify how’s the Pattern Recognition in the QuickU Stock Dataset to determined each step by step of analysis that could strengthen the forecasting results.
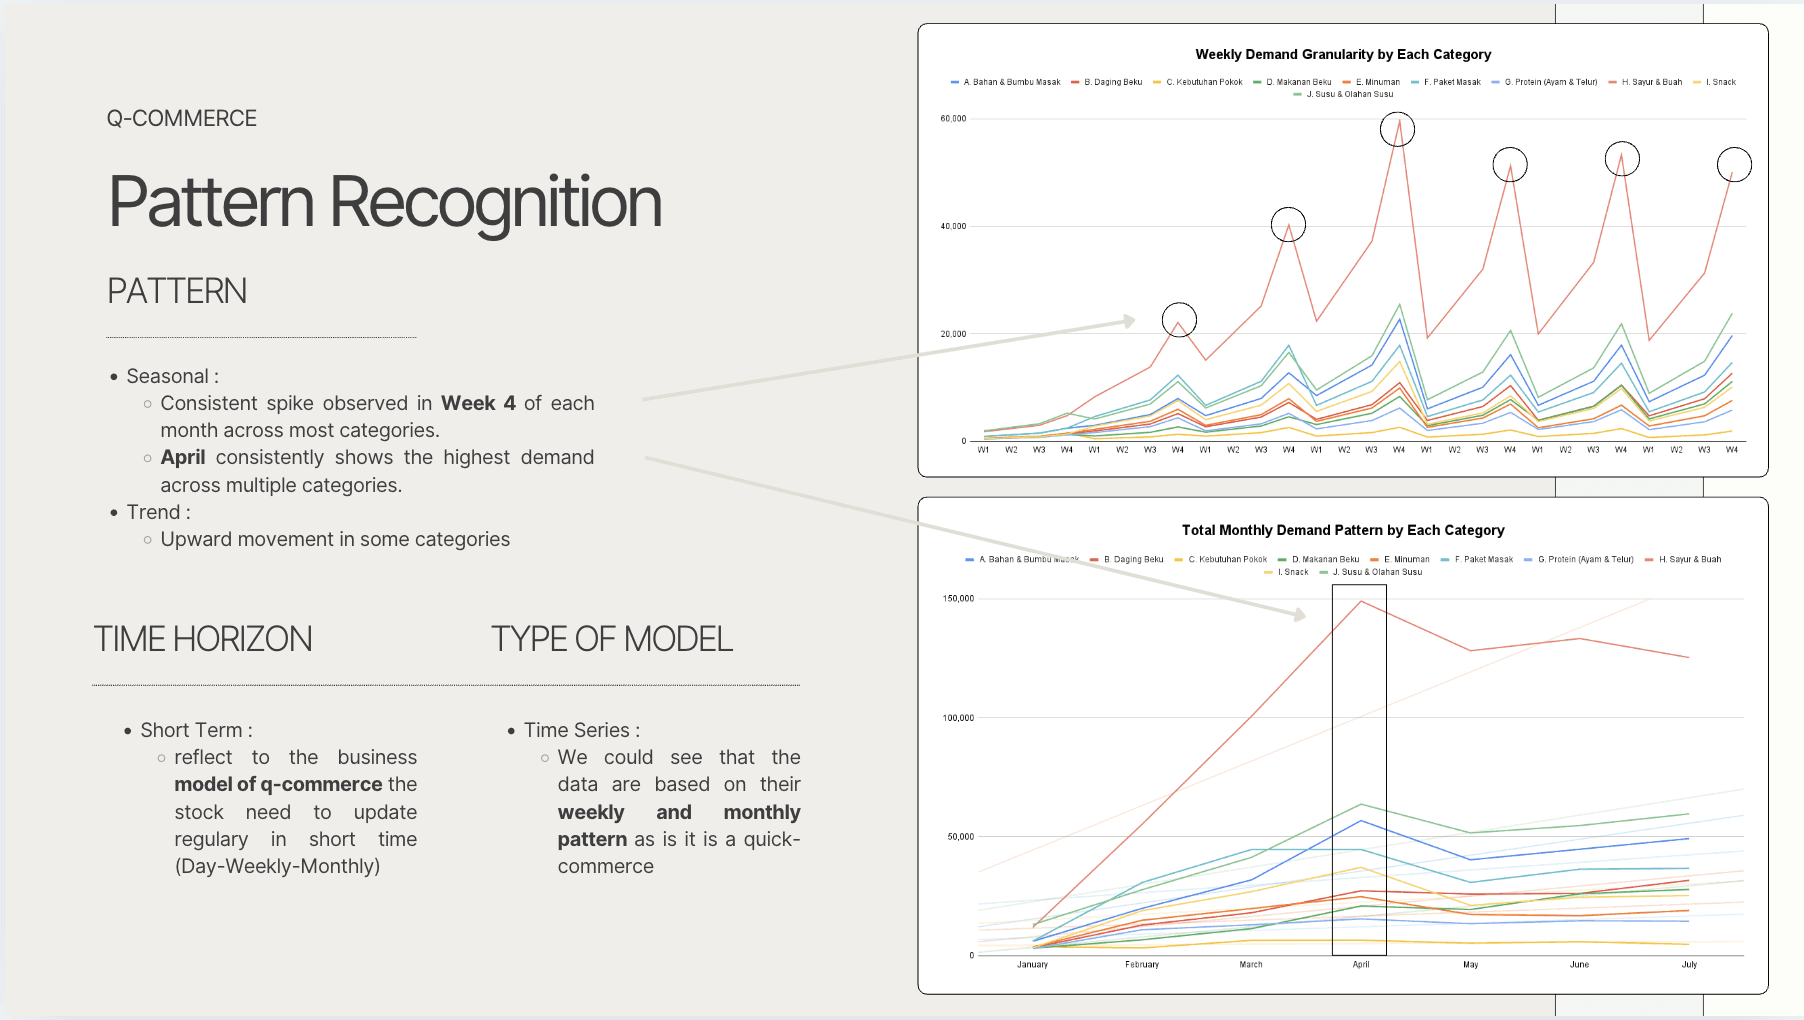
Weekly and Monthly Granularity to check the stock distribution in each month and define the Pattern
Then, after I analyzed the week and monthly granularity, I determined which of the forecasting method that fit and suit for the stock planning based on the variables that available and the type of data, and founded Holt Winters by using Triple Exponential Smoothing to check the parameter and controlled the value by using Average Performance Metrics
Three Exponential Smoothing Parameters
Parameter | Explanation | Value |
|---|---|---|
Alfa | Controls the weighting of recent observations in updating the level. | 0.9 |
Beta | Governs how rapidly the trend adapts to new data. | 0.1 |
Gamma | Adjusts how much the seasonal component changes with each period. | 0.8 |
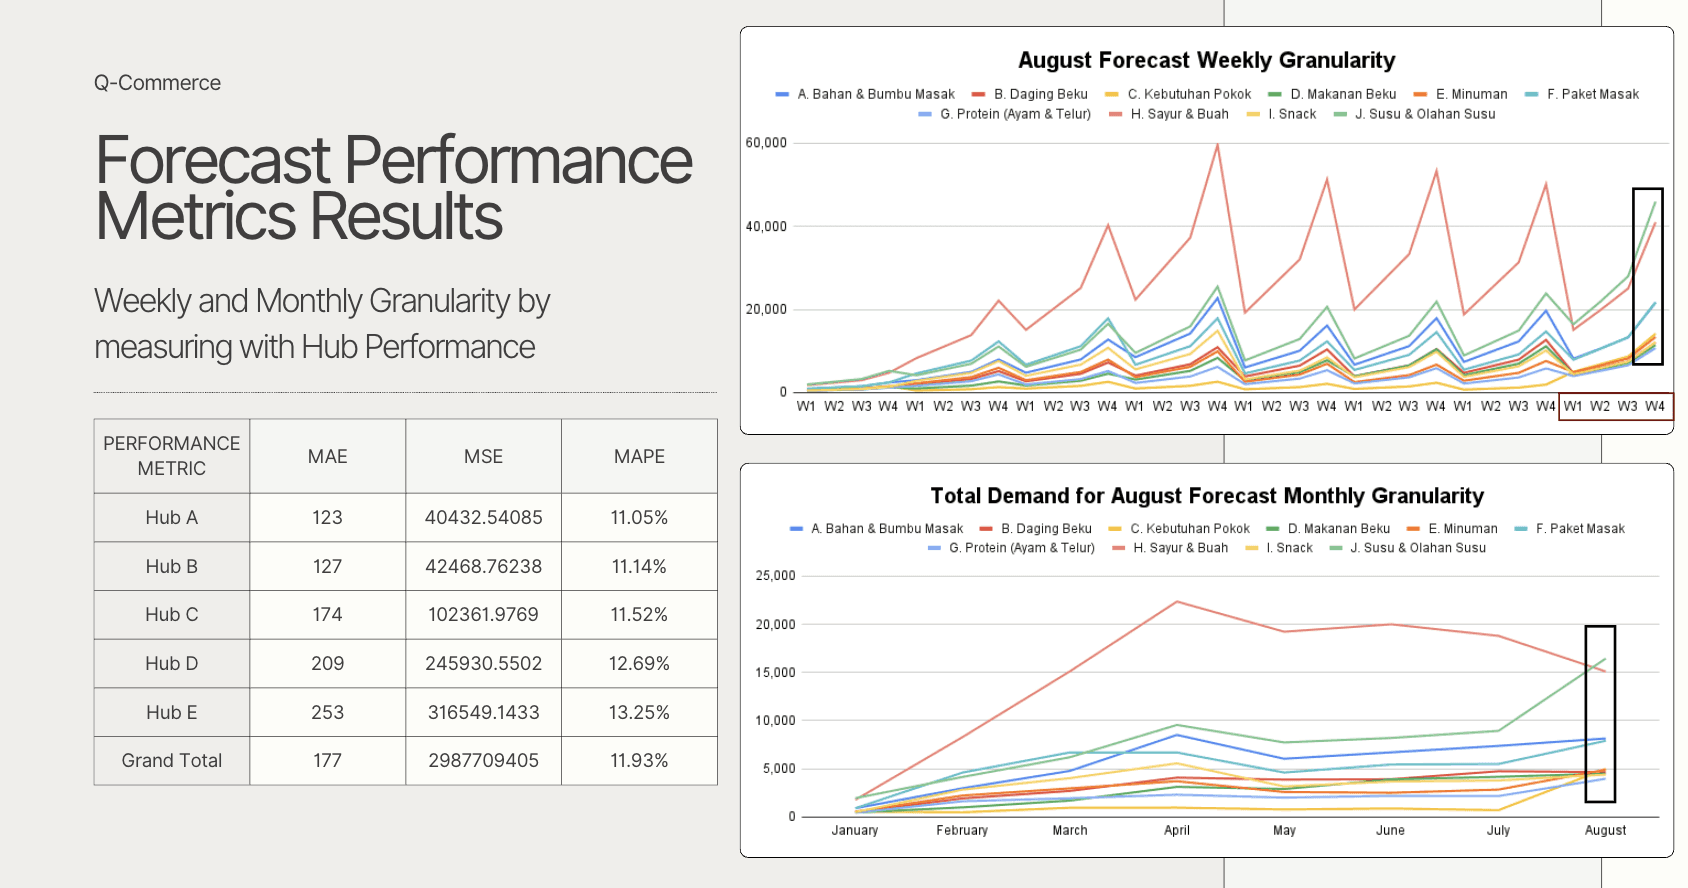
Average Performance Metrics
Parameter | Explanation | Value |
|---|---|---|
MAE (Mean Absolute Error) | Measures the average magnitude of error in absolute terms. | 177,2 |
MSE (Mean Squared Error) | Useful to detect model variance and extreme forecasting errors. | 2987709405,4 |
MAPE (Mean Absolute Percentage Error) | Represents error as a percentage of actual demand. Allows comparison across different categories and time periods. Especially relevant in business contexts for interpretability (e.g., “our forecast was 8% off”). | 11.93% |
After the Pattern Recognition process, I acknowledged how the Holt-Winters process went and how it could be generate or use for the Forecasting Method. In this process I needed to implement how the Initial Trend Formula also this method decomposes the time series using the Level, Trend and Seasonal
Holt-Winters Decomposes the Time Series into three Parameters :
Parameters | Explanation | Formula |
|---|---|---|
Level (ℓ) | The smoothed estimate of the current baseline demand. | ℓt=α(yt−st−m)+(1−α)(ℓt−1+bt−1) |
Trend (b) | The growth or decline in demand over time. | bt=β(ℓt−ℓt−1)+(1−β)bt−1 |
Seasonality (s) | The recurring fluctuations due to temporal patterns (weekly/monthly spikes). | st=γ(yt−ℓt)+(1−γ)st−m |
Initial Trend to Calculate the Holt Winters Decomposes Parameters
Month 1 | Month 2 | Month 2 - Month 1 | (Month 2-Month 1) / (Total Week) |
|---|---|---|---|
add the month 1 data | add the month 2 data | decrease both of it | the result divide by the amount of week you want to analyze |
After understanding the method, Intentionally i forecasted for each of the category in each of hub also where the category amounts are 10 and there are 5 hub need to be analyzed in this terms I managed to forecasted 50 values for august 2022 that can comprehend the usage of forecasted and implemented in the real data.
Then combined each of the results in each of hub to see how the august forecasting results
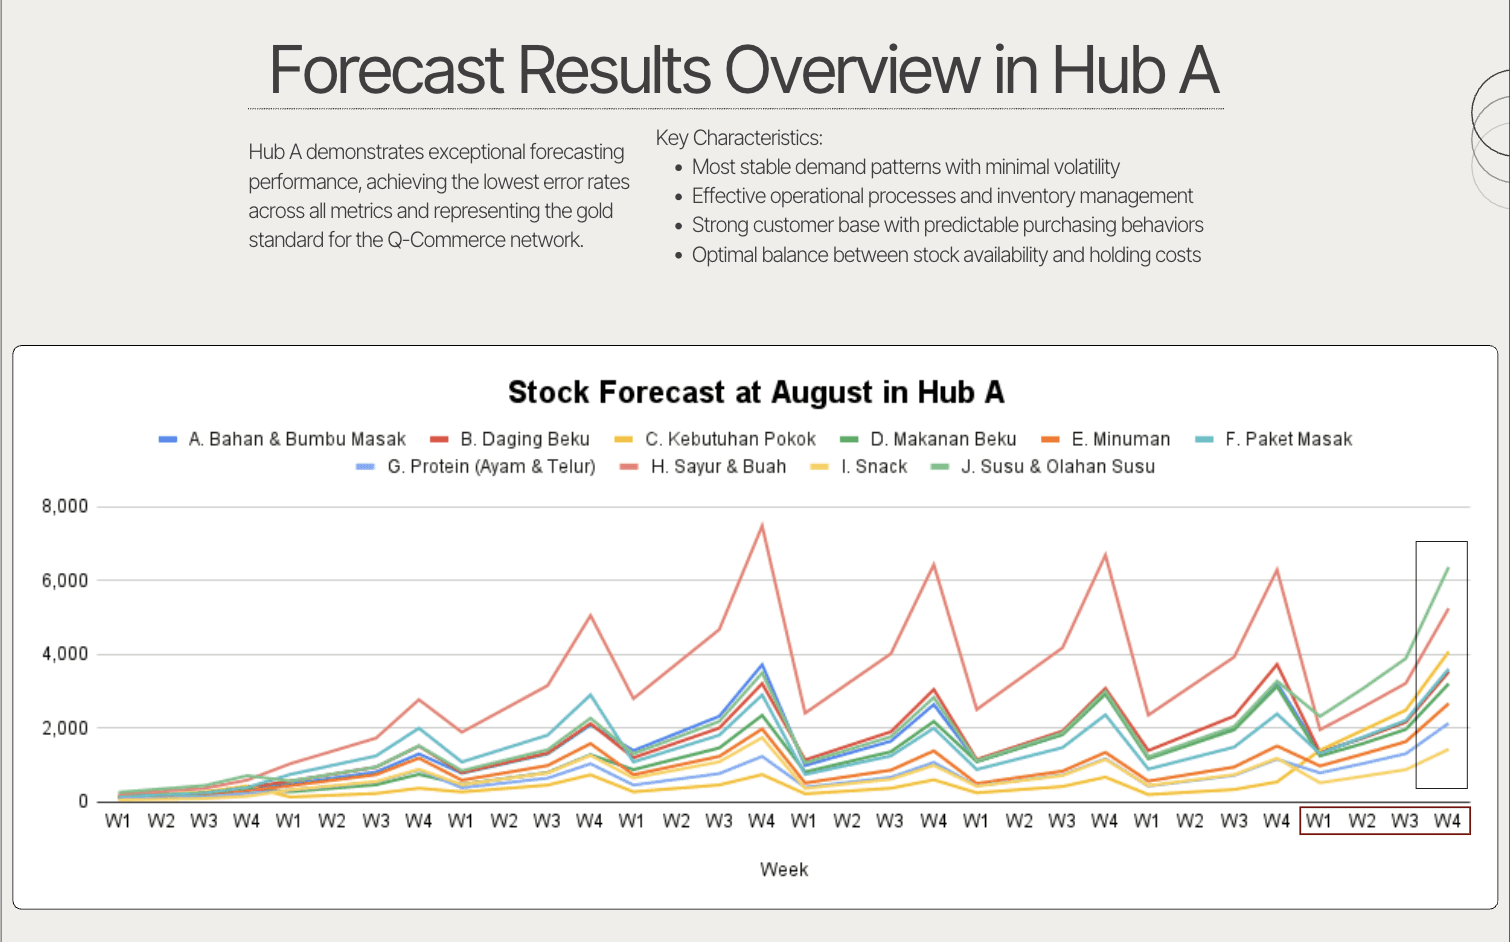
Hub A Forecasting Results
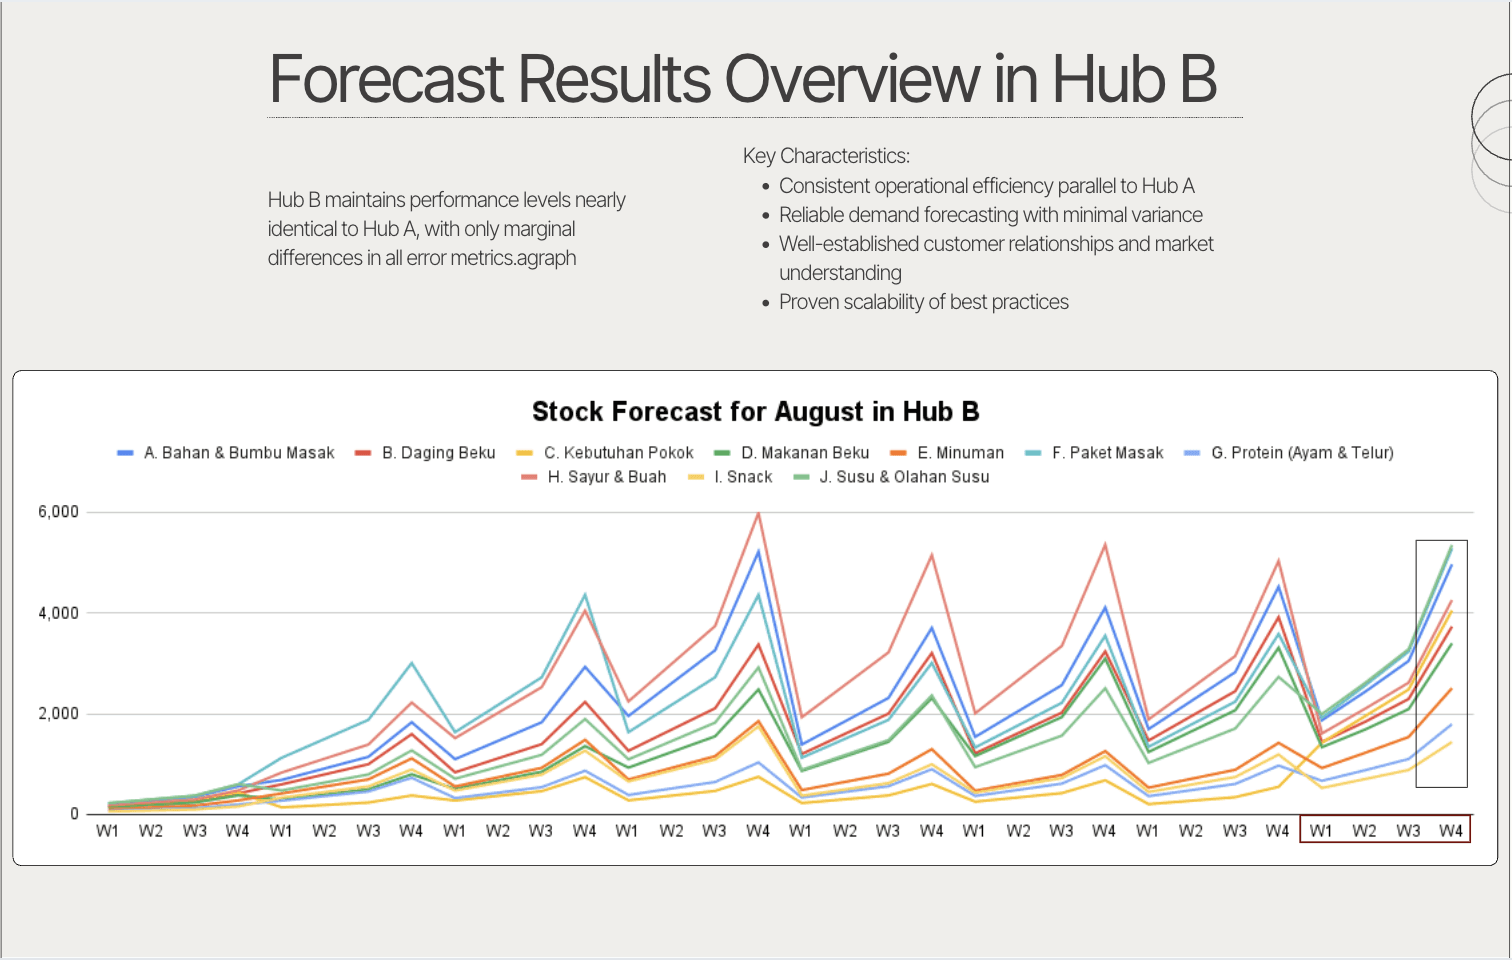
Hub B Forecasting Results
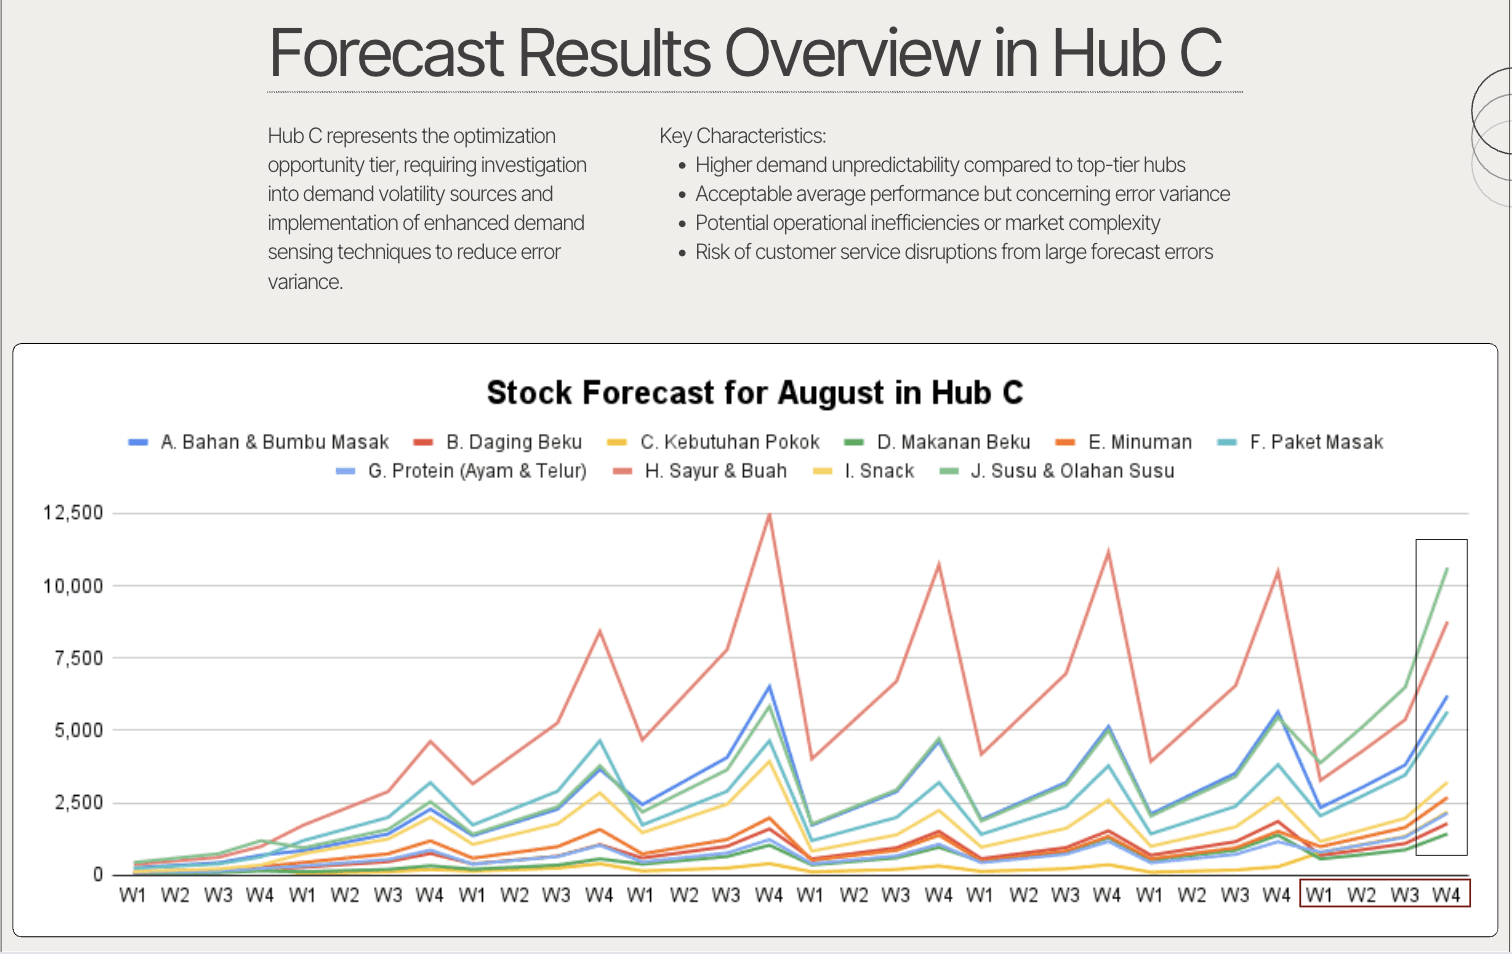
Hub C Forecasting Results
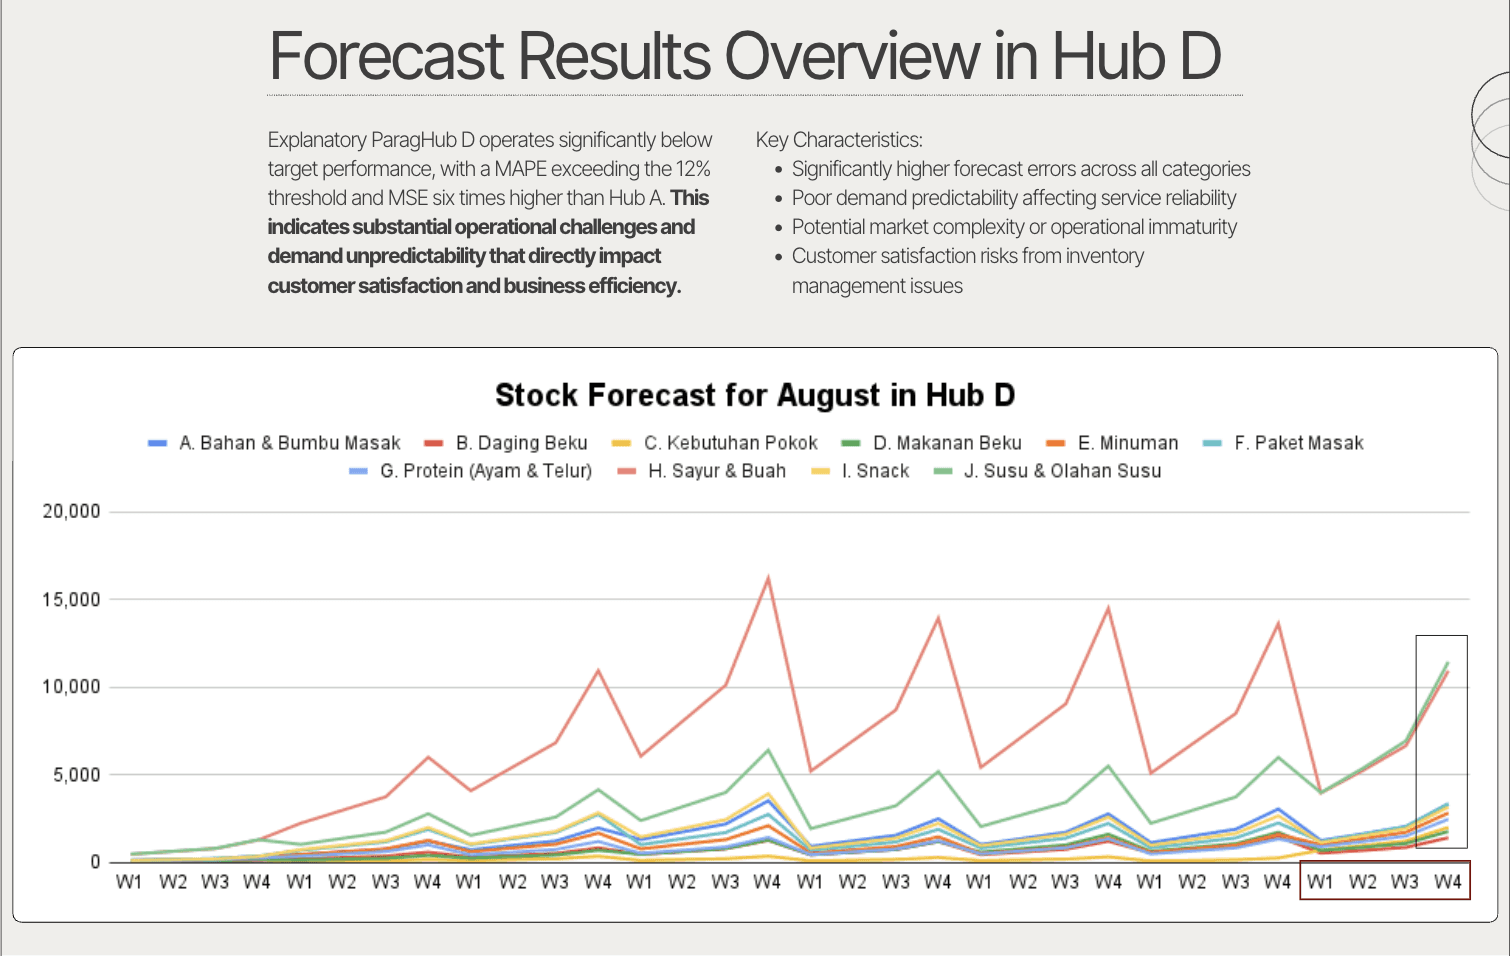
Hub D Forecasting Results
Hub E Forecasting Results
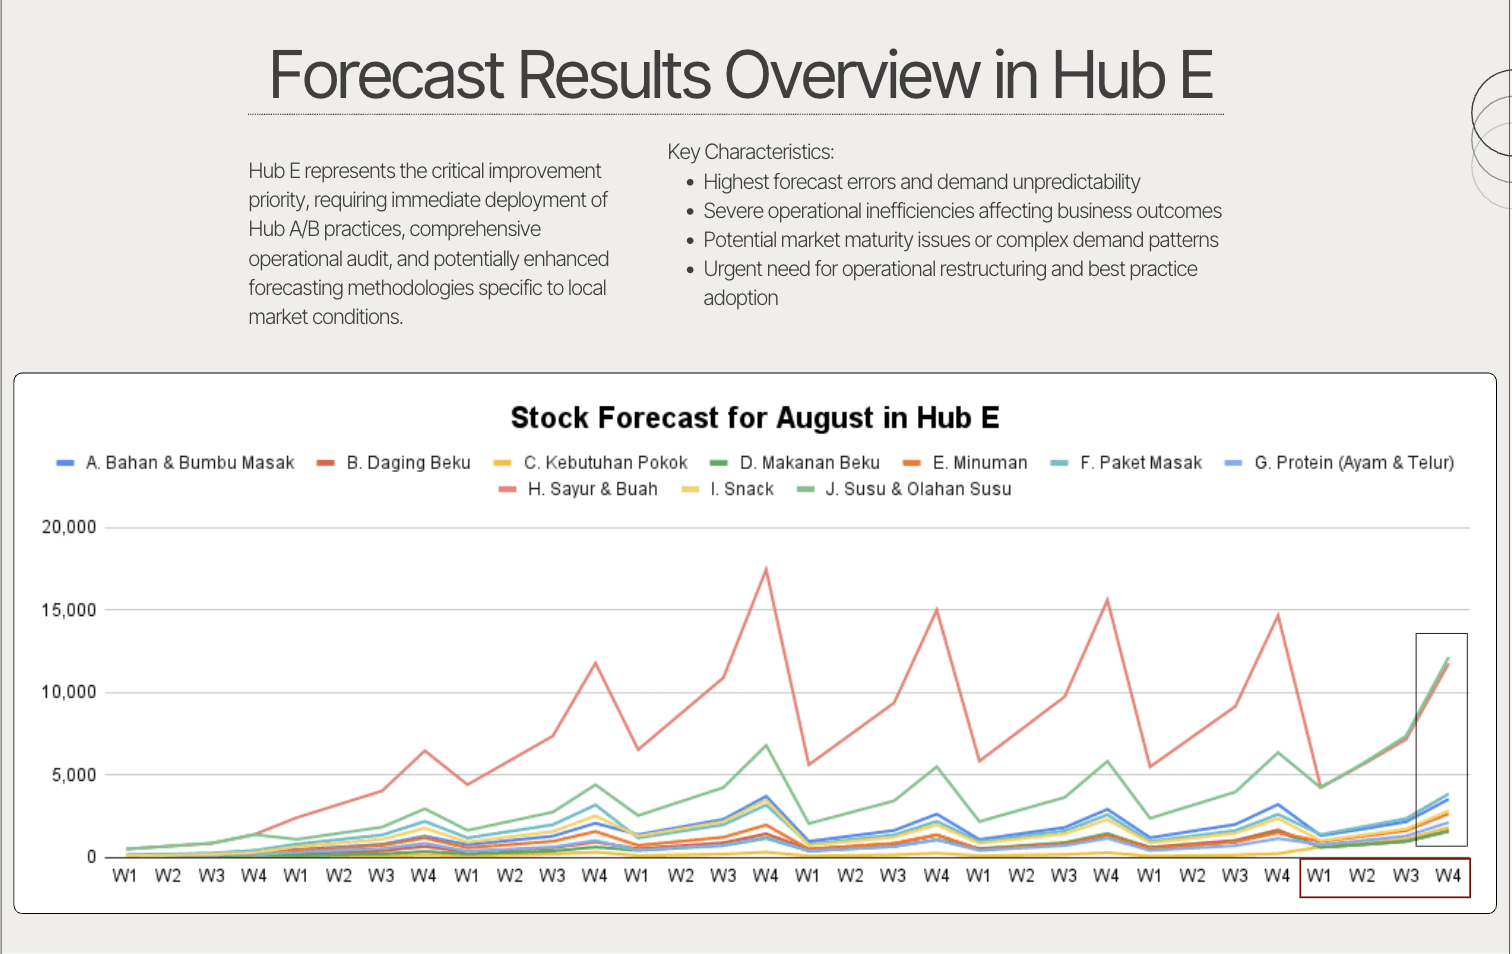
Also as the output of the results, I checked the forecast performance by using the Performance Metrics
Step 3
Actionable Recommendations - Forecast Error Based Safety Stock
Implemented the forecast error based safety stock so QuickU could tailored to each hub’s actual forecasting performance
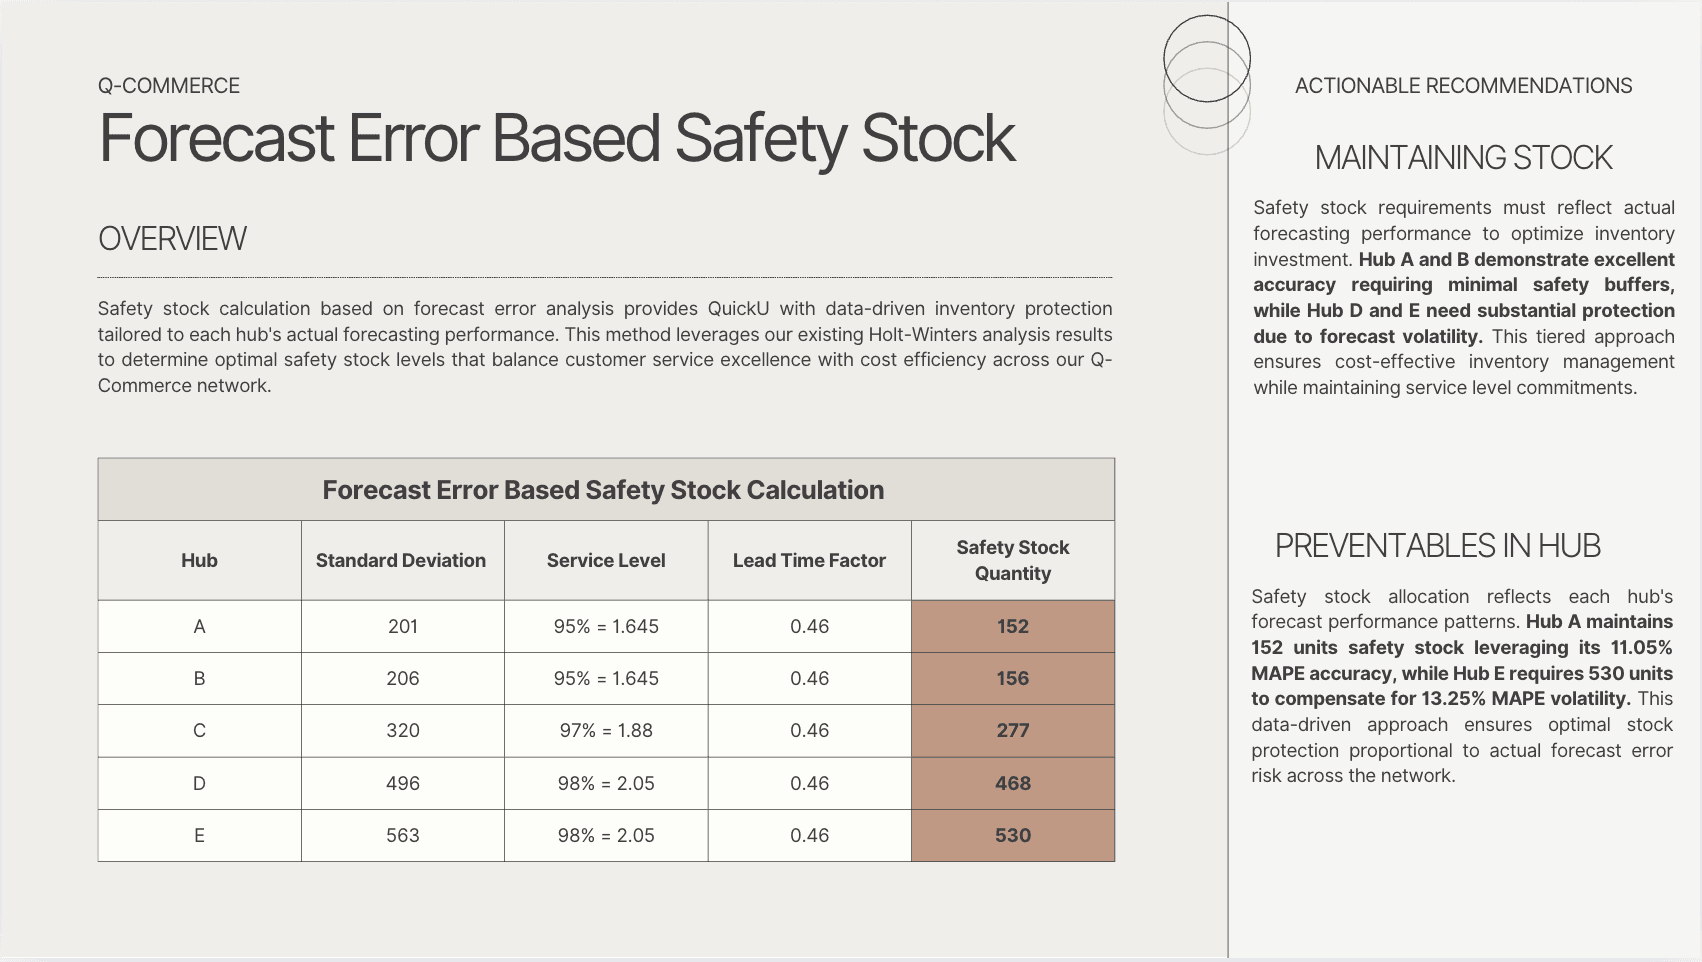
Also propose to implement the Tier Based Hub Deployment Strategy for inventory planning