
OCA Telkomsel Dashboard
Developed a centralized performance dashboard for OCA Indonesia (Telkom’s CPaaS arm), integrating WhatsApp, SMS, Email, and Voice Calls. The project aimed to unify performance reporting, enable channel comparison, and provide actionable insights for business growth and operational efficiency.
Client:
RevoU x OCA x Telkomsel Indonesia
Date:
August 14, 2025
Type:
Dashboarding
Role:
Data Analyst

About
The project, “OCA Optimization Performance with Centralized Dashboard”, was developed as part of the RevoU x Telkom Indonesia Virtual Internship Program. It focused on building a unified reporting system for OCA Indonesia, Telkom’s Communication Platform-as-a-Service (CPaaS).
By consolidating data from WhatsApp, SMS, Email, and Voice Calls, the project delivered an interactive dashboard that empowered stakeholders to:
Track multi-channel performance in real-time.
Compare delivery success, failure, and revenue contribution across channels.
Analyze customer engagement patterns by industry and user segment.
Optimize channel investments and reduce operational inefficiencies.
Project Focuses :
Create a centralized view of OCA’s communication platform.
Enable channel performance comparison (WhatsApp, SMS, Email, Calls).
Deliver actionable KPIs for executives and managers.
Identify engagement trends by industry and user behavior.
Recommend channel-specific optimization strategies. </aside>
Problem Breakdown :
OCA Indonesia lacked a unified reporting system for its communication channels, resulting in:
Fragmented and siloed data.
Inconsistent KPIs across platforms.
Limited ability to monitor customer engagement.
Difficulty in making informed channel investment decisions. </aside>
<aside> 📌
Problem Statment :
“How can OCA develop a centralized channel performance reporting system that improves operational efficiency, strengthens customer engagement insights, and drives sustainable business growth?“
</aside>
Key Deliverables
Executive Overview Dashboard – top-level KPIs (transactions, revenue, delivery/failure rates, channel share).
Channel Comparison Dashboard – cross-channel performance and ROI analysis.
User Behavior Dashboard – user segmentation, industry usage patterns, engagement trends.
Strategic Recommendations – investment roadmap and channel-specific action plans.
Essential Link :
Context
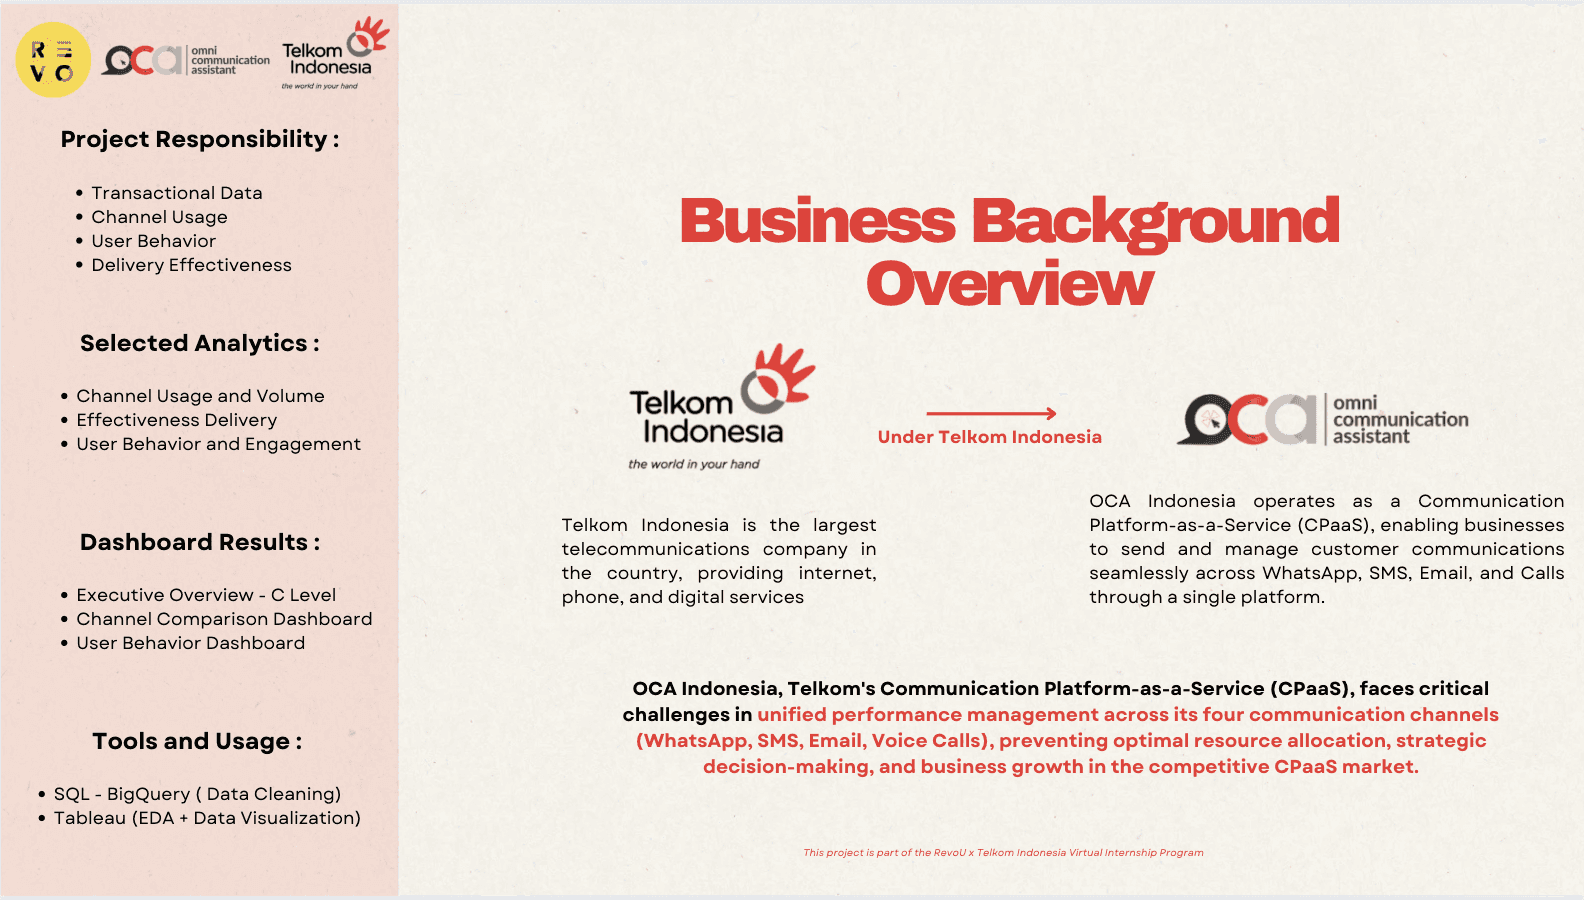
OCA Indonesia, a subsidiary of Telkom Indonesia, operates as a **Communication Platform-as-a-Service (CPaaS)**provider, enabling businesses to reach customers through WhatsApp, SMS, Email, and Voice Calls. Every interaction whether a promotional SMS, transactional WhatsApp message, or outbound call—generates valuable transactional data.
With over 120,000+ multi-channel transactions recorded in the dataset, OCA’s platform represents a diverse communication ecosystem. Different industries, such as Finance, Real Estate, and E-commerce, display unique messaging behaviors, delivery challenges, and engagement outcomes. This presents both opportunities and complexities in understanding cross-channel performance, optimizing delivery, and personalizing customer engagement strategies.
Business Environment
Multi-channel CPaaS platform integrating WhatsApp, SMS, Email, and Calls into a single service.
Diverse industry usage (Finance, Real Estate, Travel, E-commerce), each with distinct communication needs and engagement patterns.
Channel performance disparities, with WhatsApp and SMS driving most revenue, Email supporting engagement, and Calls facing critical reliability issues.
Competitive CPaaS market, where platform reliability, delivery effectiveness, and actionable insights determine client retention and growth.
Strategic necessity for data-driven decision-making, enabling OCA to allocate resources effectively, optimize underperforming channels, and diversify revenue streams.
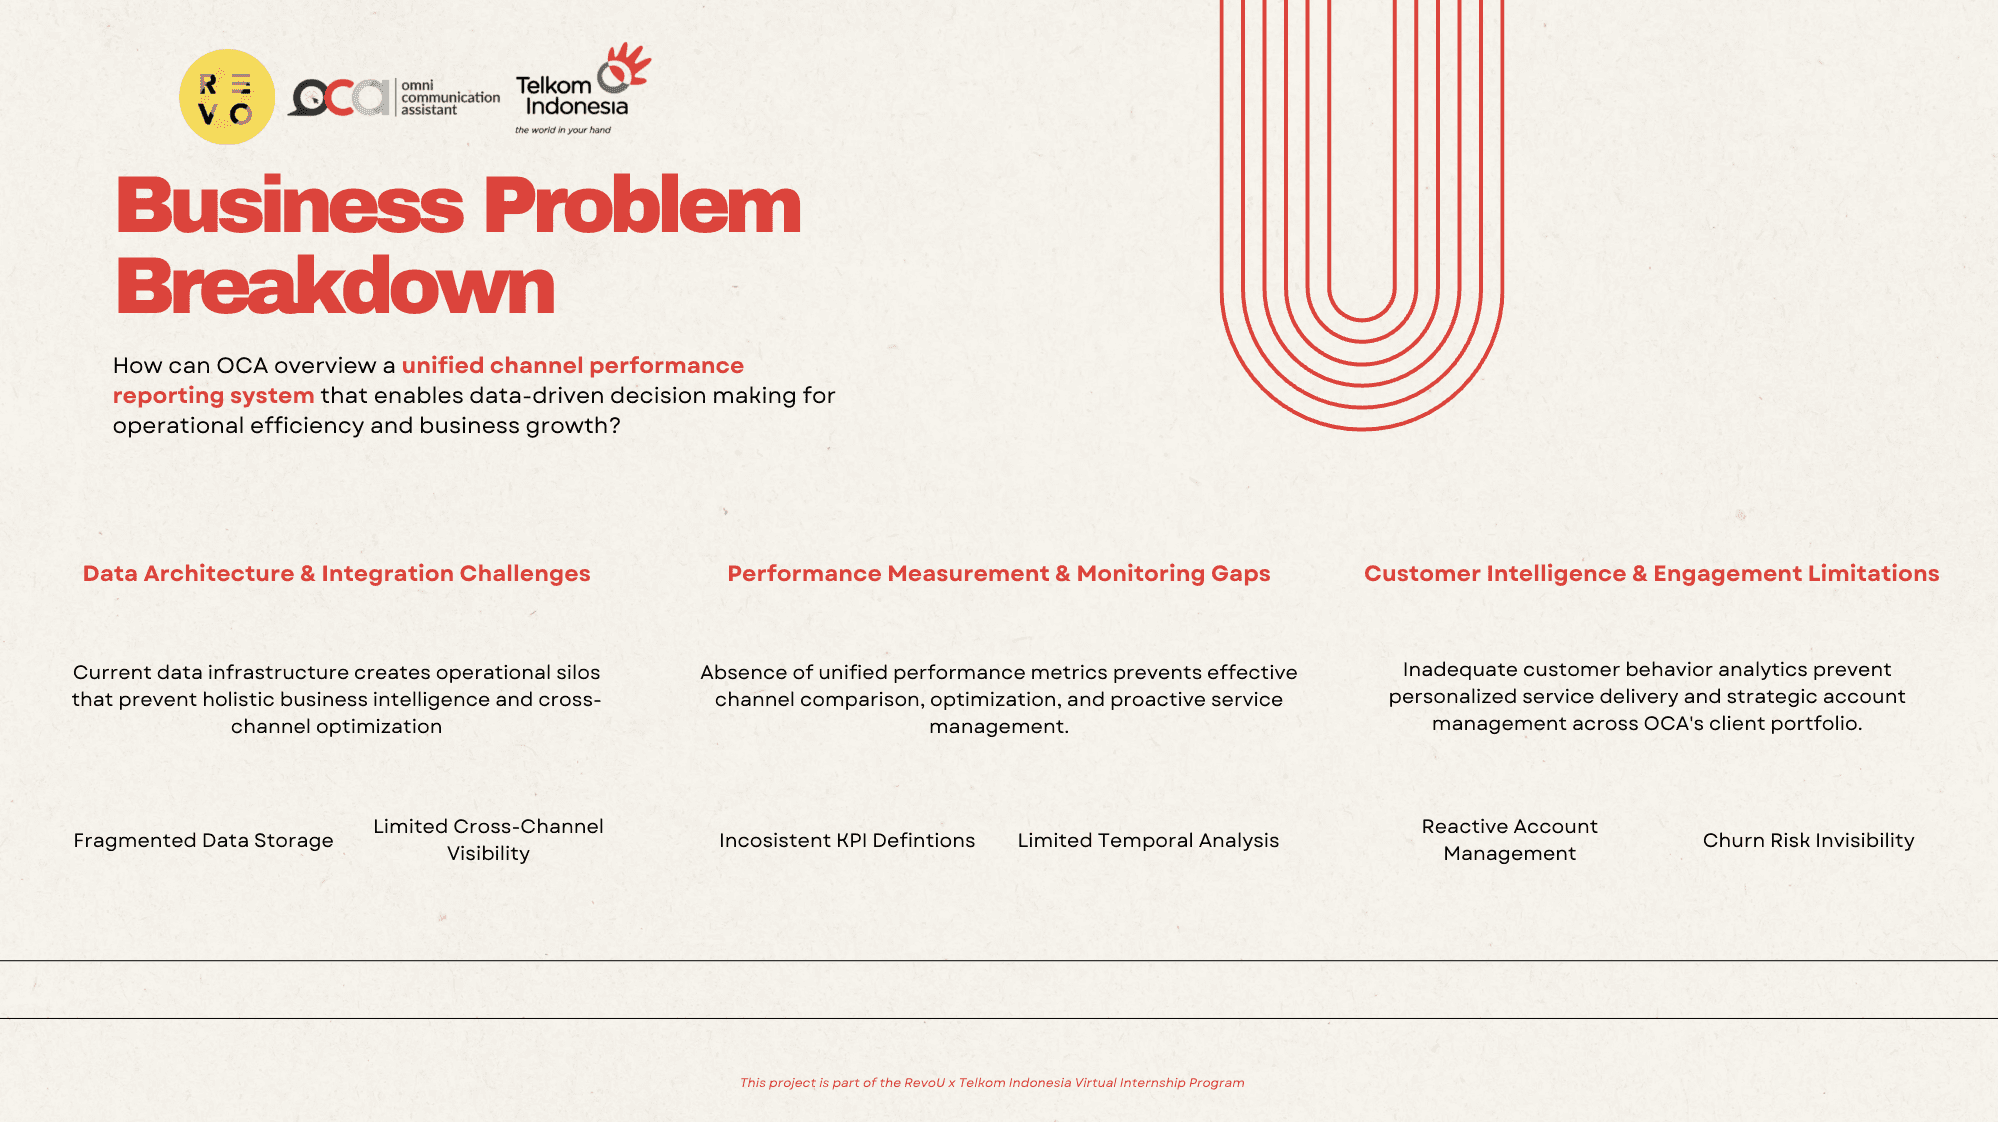
Problem
In a clear understanding of the objective in a terms of Project Focuses and Problem Breakdown OCA needs “a centralized channel performance reporting system that improves operational efficiency, strengthens customer engagement insights, and drives sustainable business growth”
Contemplating each root causes by using Mutually Exclusive and Collectively Exhaustive, here’s the Problem Breakdown
from business problem breakdown we could see the possible recommendations how’s the business impact
Business Impact
Enabled C-level executives to make data-driven investment decisions.
Improved reporting efficiency by consolidating four silos into one dashboard.
Identified WhatsApp as the champion channel (46% revenue, 0% failure).
Highlighted critical Call channel failures (78% failure rate) → informed immediate corrective action.
Exposed revenue concentration risks (over-reliance on WhatsApp) → recommendation for diversification.
Objective
To Deliver a centralized dashboard that provides real-time insights into multi-channel communication performance, enabling OCA executives to increase reporting efficiency by and inform channel investment decisions from the reported data.
Process and Considerations
Step 1
Data Cleaning and Feature Engineering
Identified and cleaned each data so it could matched the data visualization in tableau, specific in each table or dataset. This cleaning and identifying process are done using SQL in BigQuery
Before Cleaned The Table
After Cleaned The Table
Users | Users_Cleaned |
|---|---|
Call | Call_Transaction_Cleaned |
Email_Transaction_Cleaned | |
WA | WA_Transaction_Cleaned |
SMS | SMS_Transaction_Cleaned |
Checked and Validated the cleaned data by overviewing the overall portfolio in each Users
Checking is there any Null Data in each of customer variables
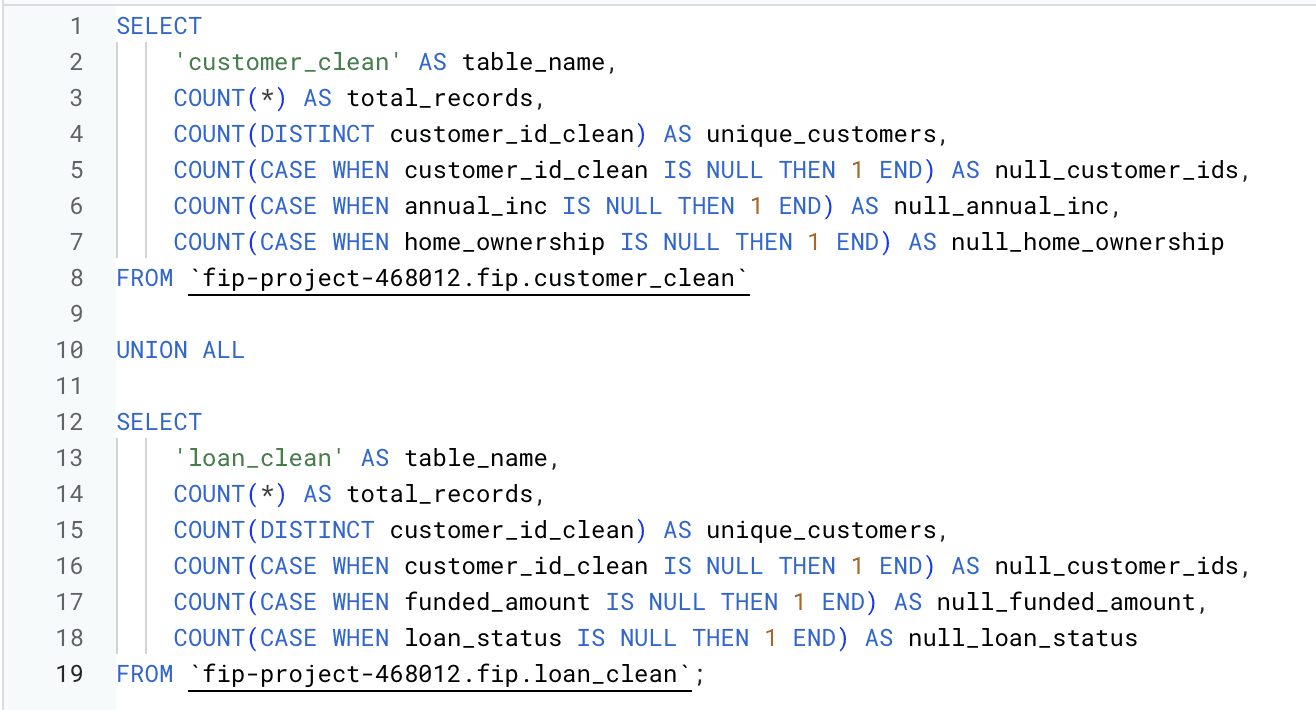

Created portfolio overview to oversee the data
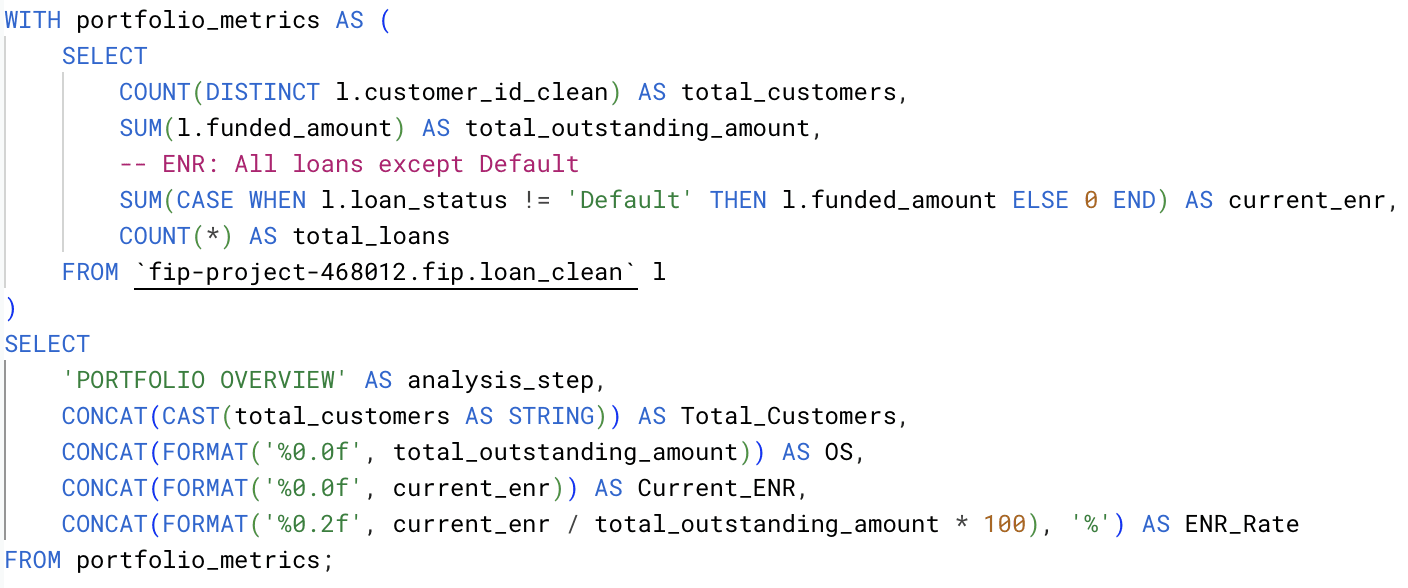

Portofolio Overview Results in BigQuery
After the data cleaning and data validation processed, I migrate the table into google sheets format so it could be process in tableau
Data Source after Migration via Google Sheets into Tableau
Step 2
Exploratory Data Analysis - Centralized Dashboard
Decided to create 3 Dashboard that managed to uncovered these areas :
Executive Summary (C Level Executives)
Channel Comparison
User Behaviour and Engagement
Executive Overview (C Level Executives Dashboard)
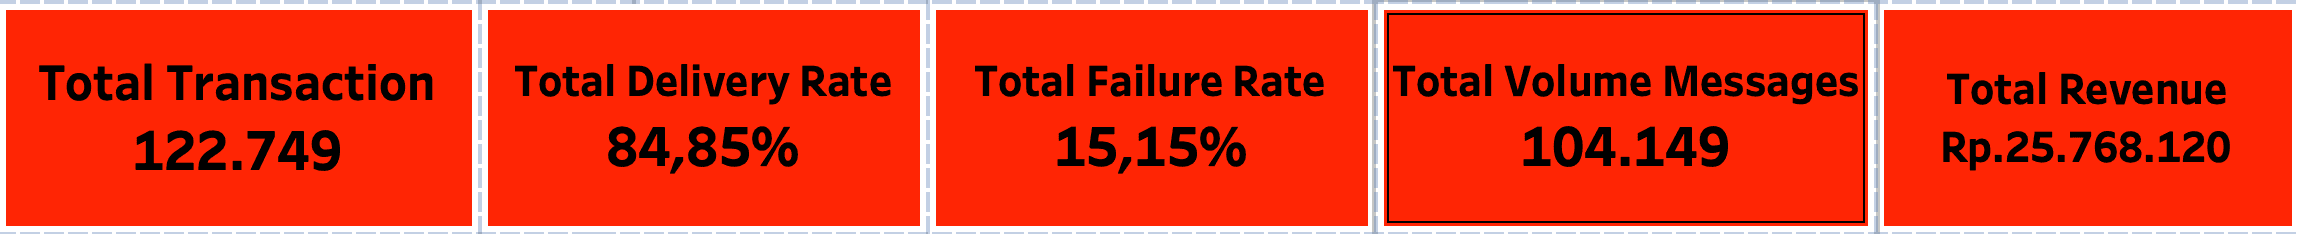
For the Executive Summary Dashboard, my first step was to identify the key performance indicators (KPIs) that best represent the overall business performance. I determined that the essential metrics were:
Total Transactions – capturing the overall business volume.
Total Delivery Rate – measuring operational efficiency.
Total Failure Rate – highlighting areas of service reliability issues.
Total Volume Messages – understanding engagement across communication channels.
Total Revenue – providing a direct link to financial outcomes.
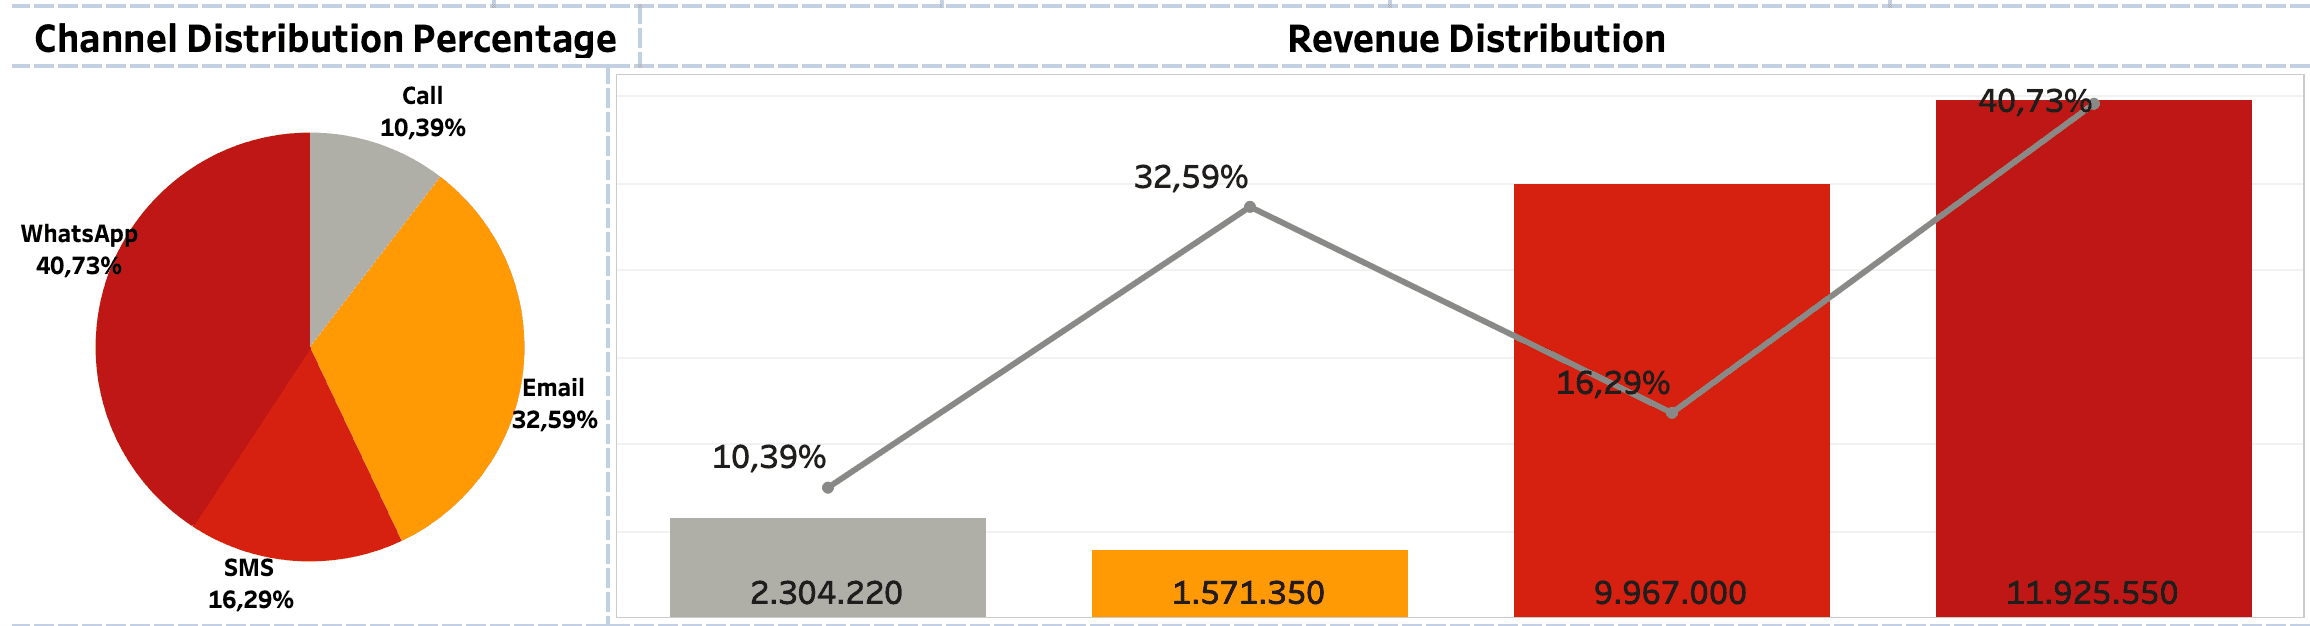
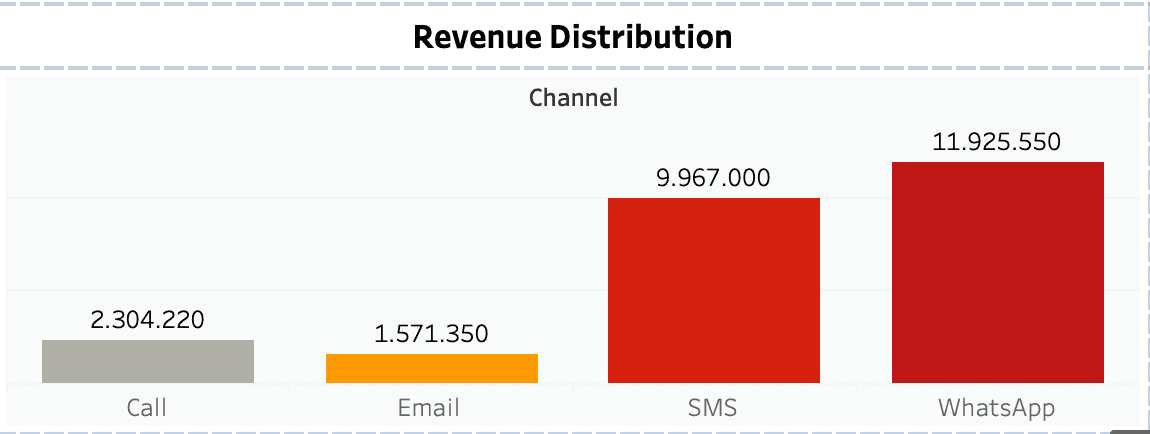
Next, I incorporated a Revenue Distribution view by combining a bar chart and a line chart. The bar chart represents the total revenue generated by each channel, while the line chart overlays the corresponding transaction percentage. This dual-layer view enables executives to easily compare whether high transaction volumes also correlate with revenue contribution across channels.
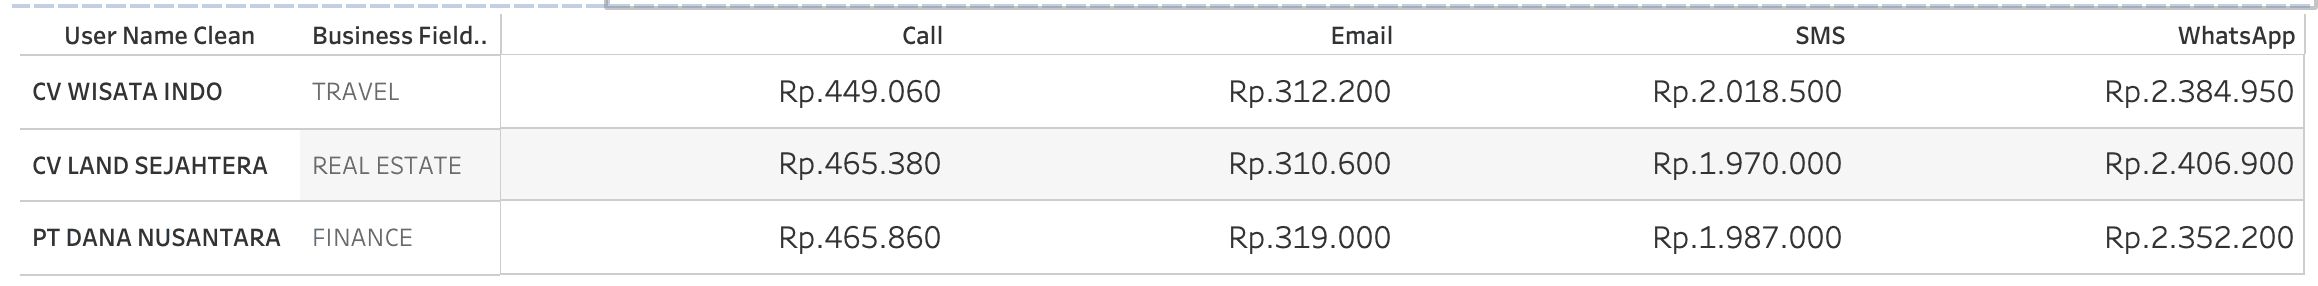
To add a business insight dimension, I highlighted the Top 3 companies generating the highest revenue. This view helps decision-makers quickly identify key accounts and evaluate how these companies distribute their communication activity across channels.
Finally, I implemented a channel filter to provide interactivity, ensuring executives can focus on specific communication channels when needed. This filter enhances the dashboard’s usability by turning it into a flexible decision-support tool.
And at the last step, I combined it all into one dashboard.
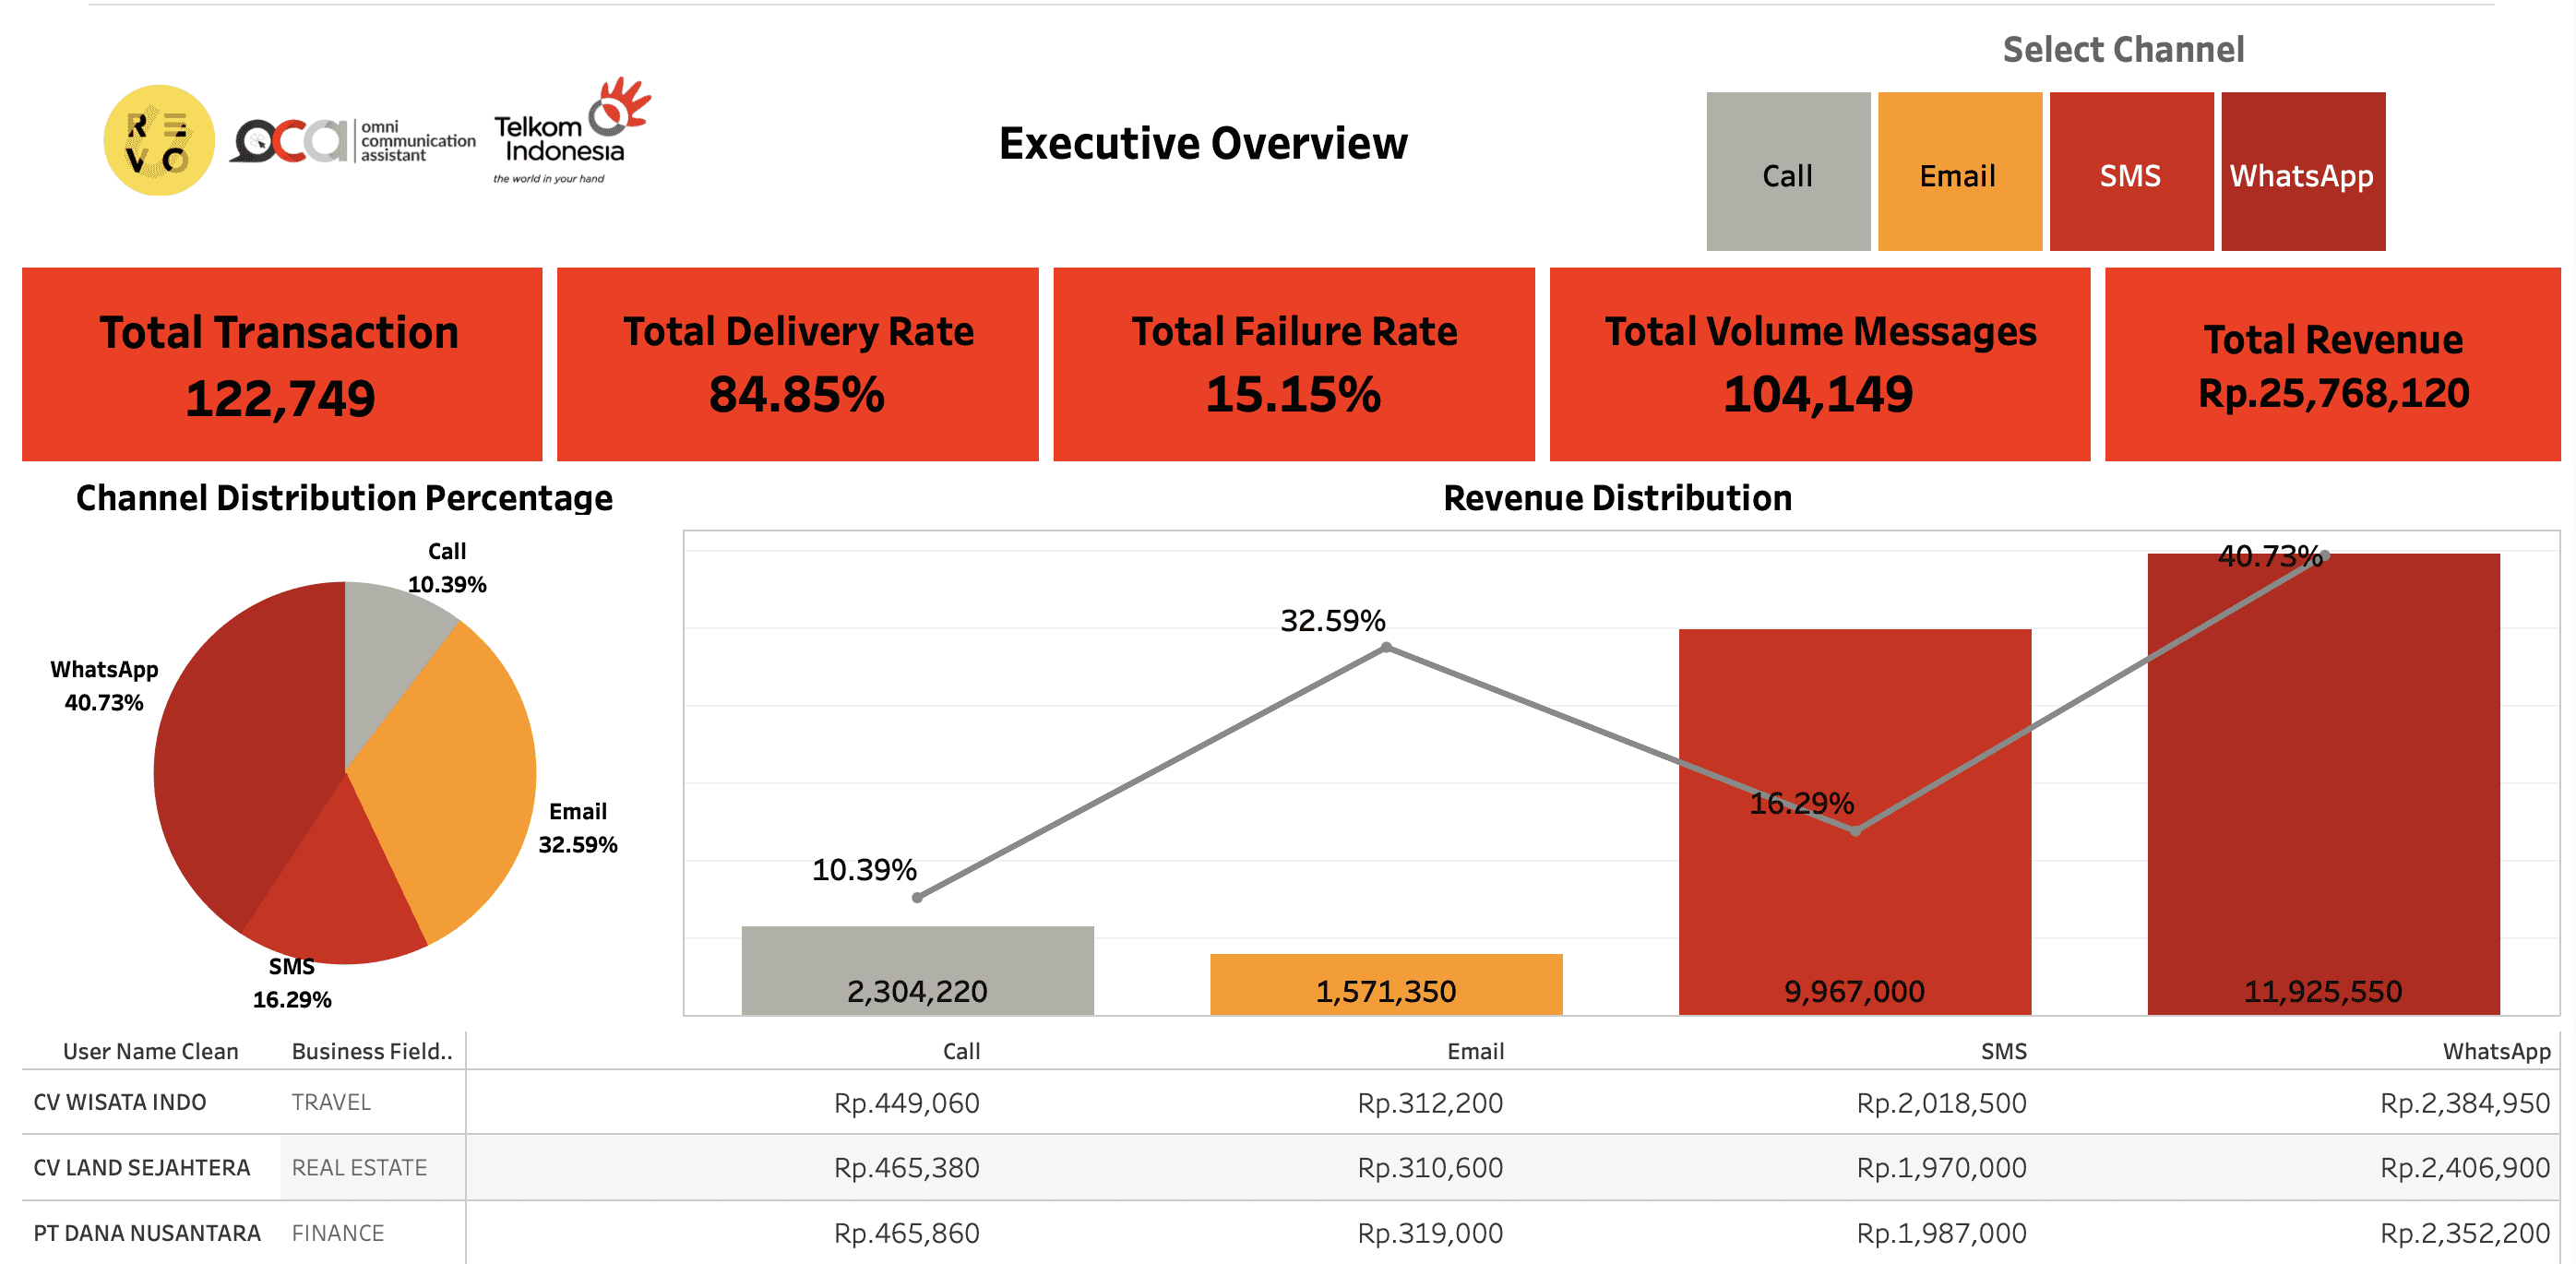
Executive Dashboard Overview Results for C Level Executives
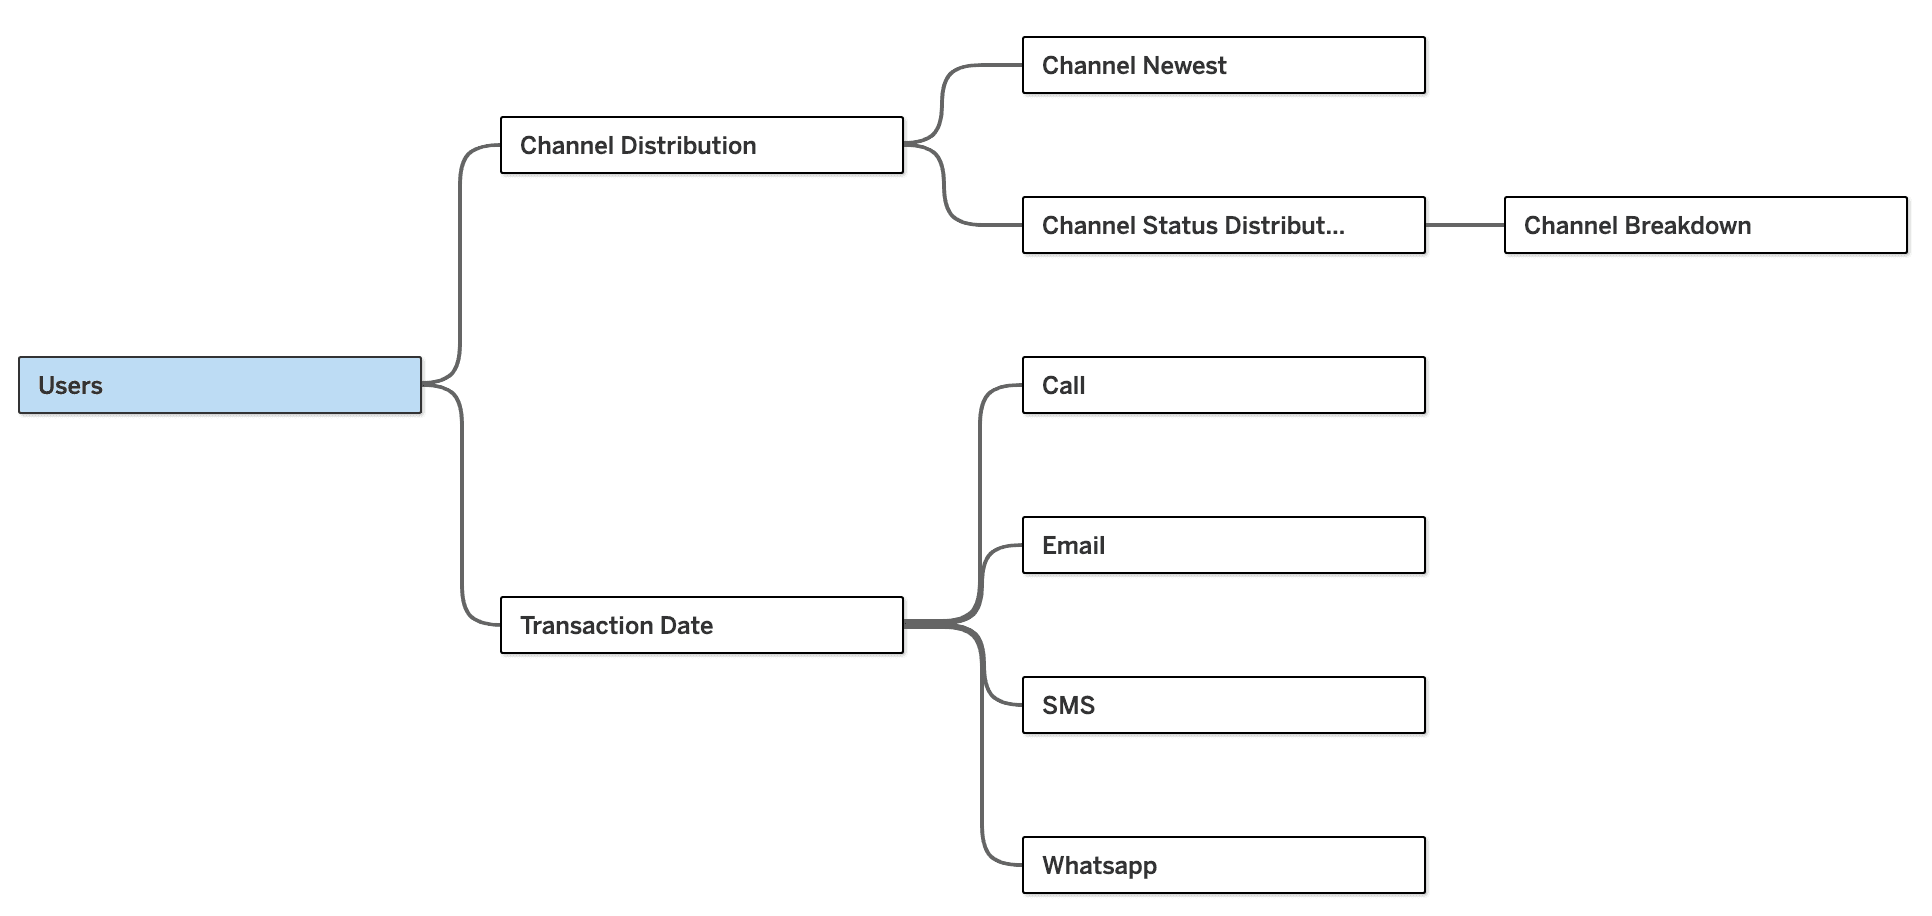
Channel Comparison Dashboard
For the Channel Comparison Dashboard, the objectives are to evaluate the efficiency, reliability, and revenue contribution of each communication channel (WhatsApp, SMS, Email, Call), enabling OCA to identify strengths, weaknesses, and optimization opportunities.
The first step was to identify the key performance indicators (KPIs) which are best to represent the overall business performance. In this i determined that the essential metrics were:
Total Delivery Rate (%) – success ratio as a reliability indicator.
Total Volume Messages – overall traffic by channel to measure adoption.
Average Revenue per Message (ARPM) – monetization efficiency per message.
Total Revenue – monetary outcome from messages.
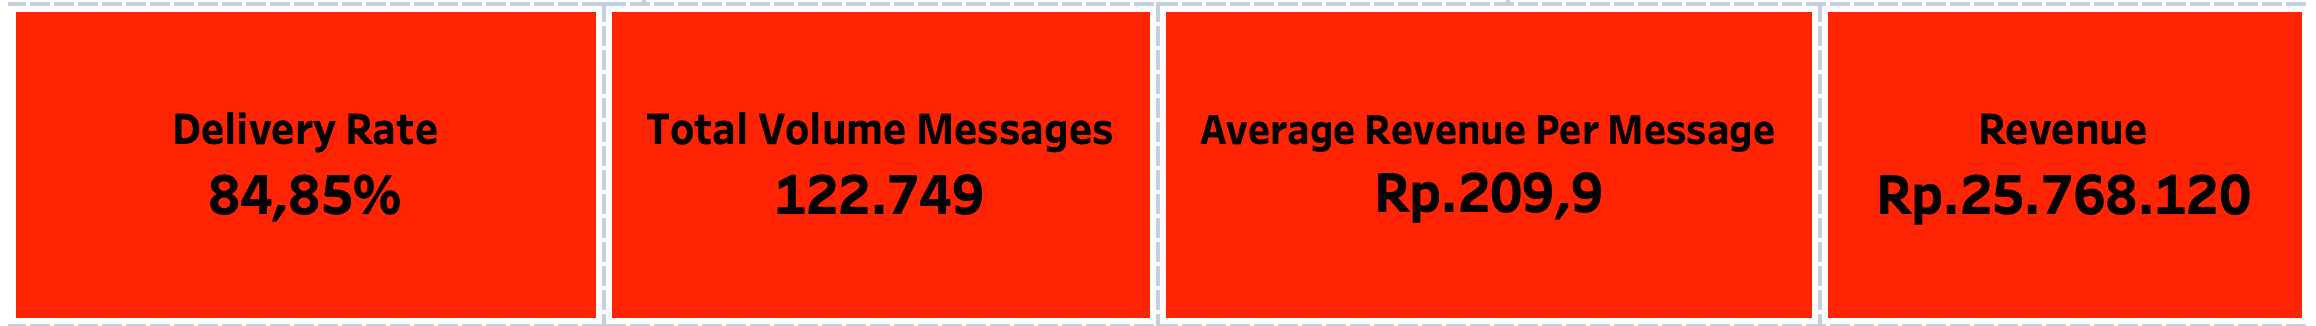
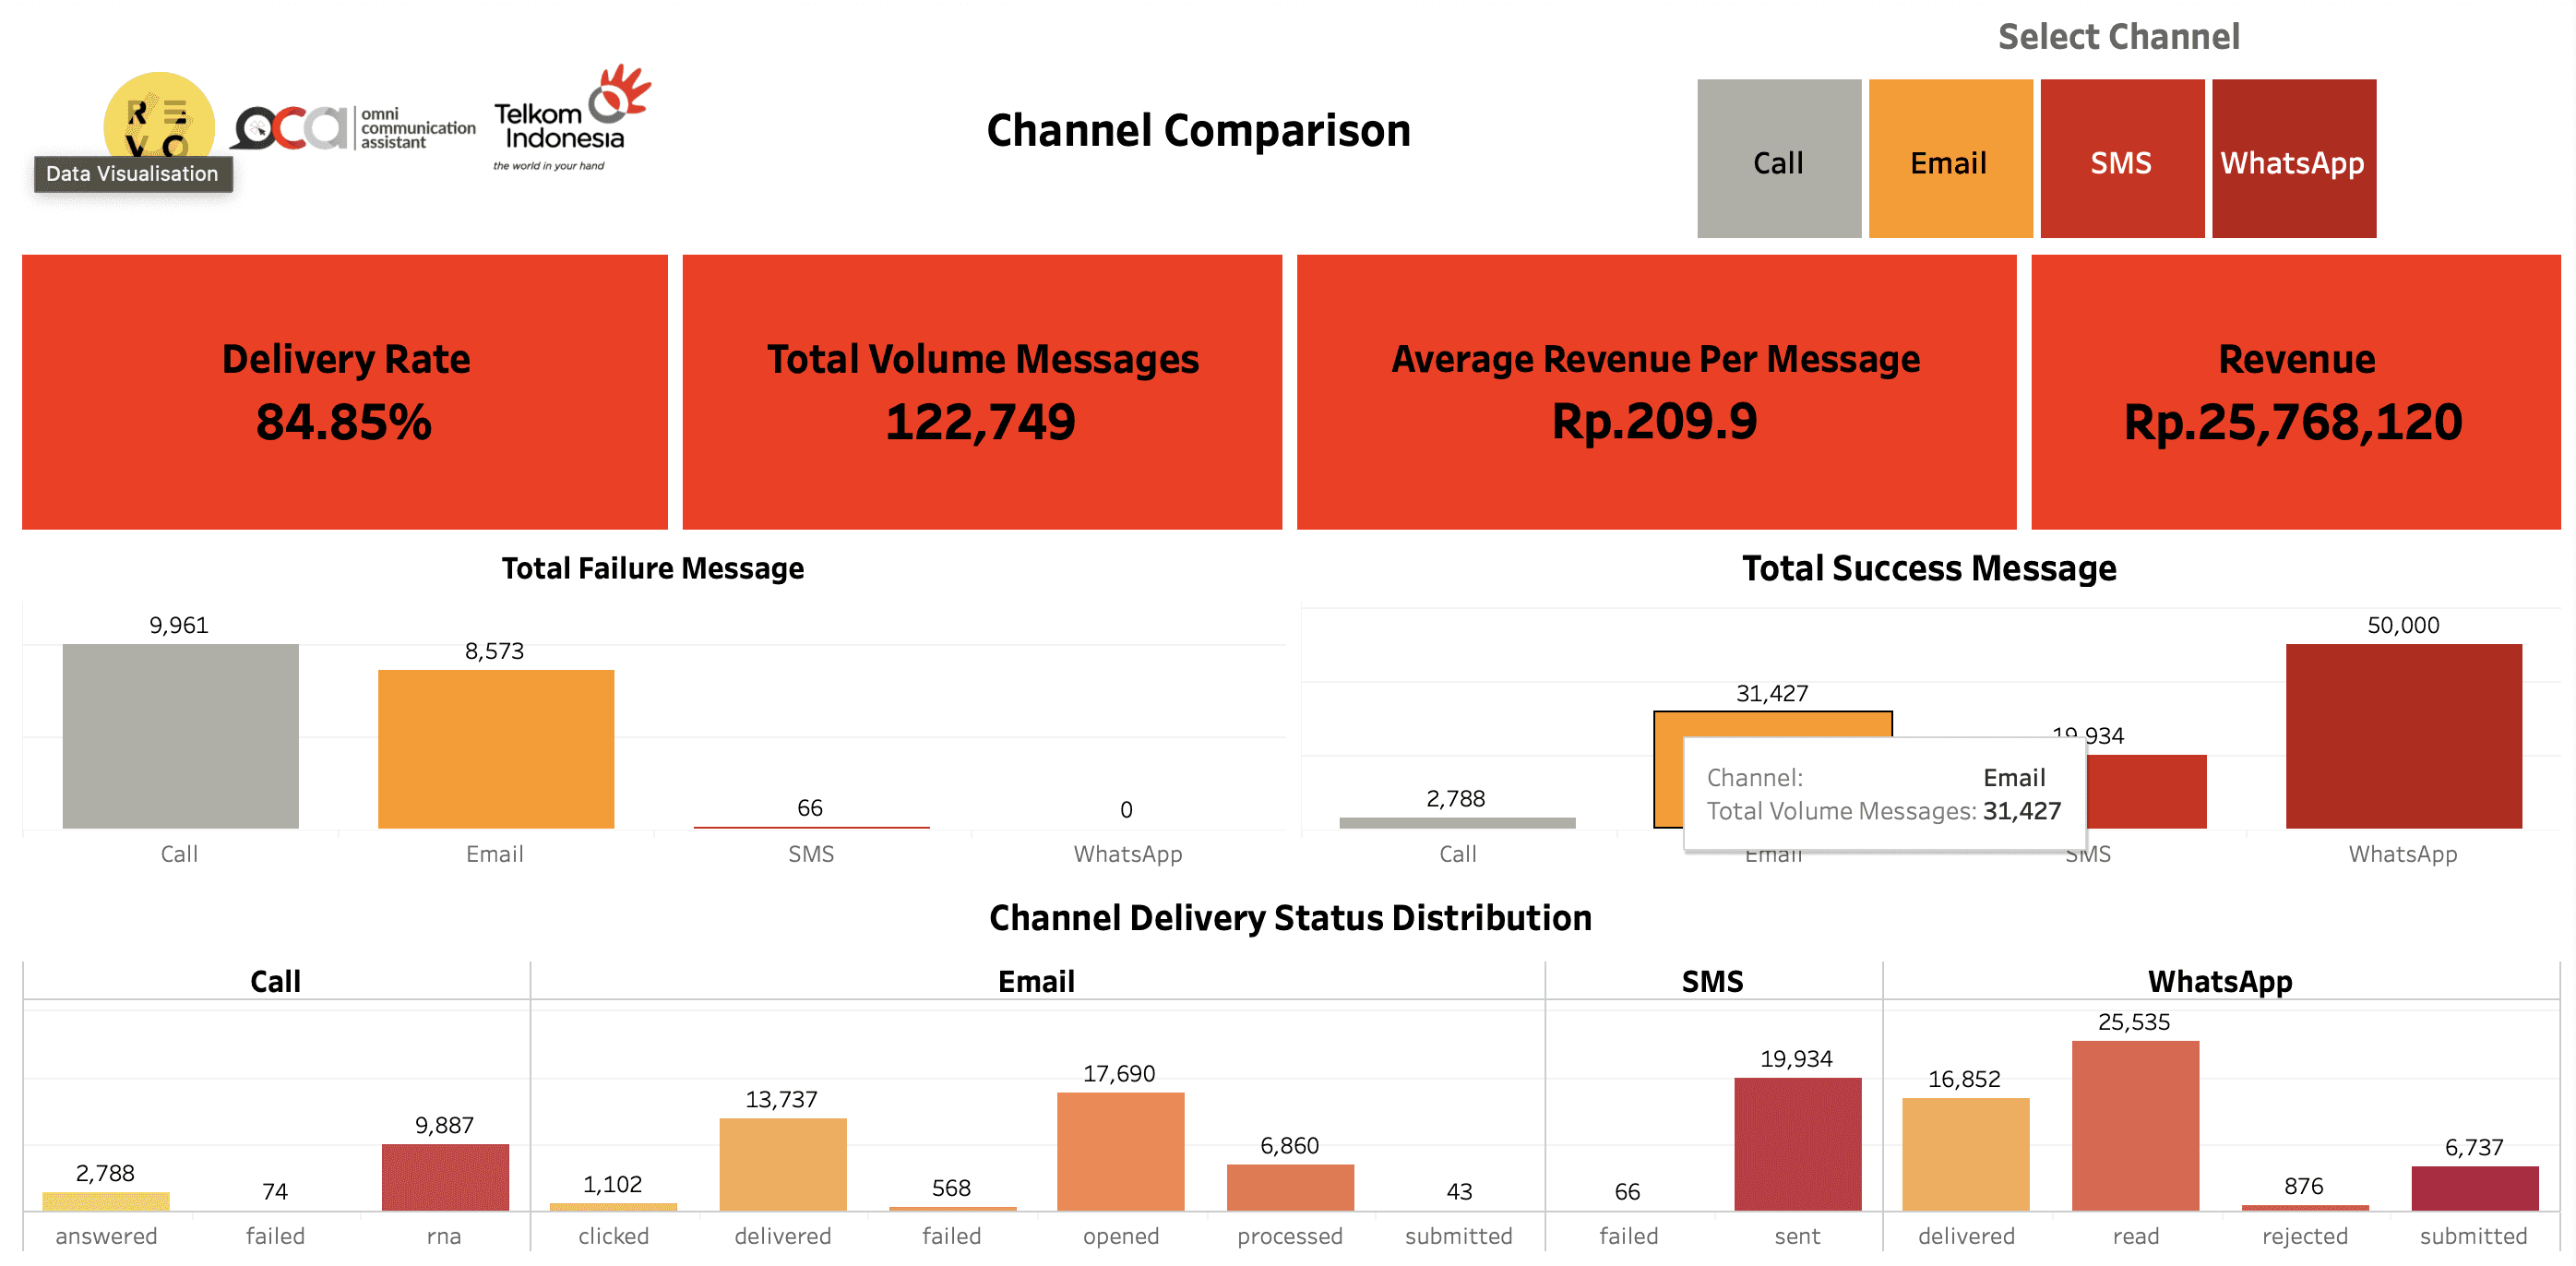
Scorecards (Header): Delivery Rate, Total Volume, Total Revenue, ARPM.
To provide a more detailed breakdown, and to help decision-makers quickly identify which channels underperform or excel. I included two bar charts:
The first represents Total Failure Messages per channel
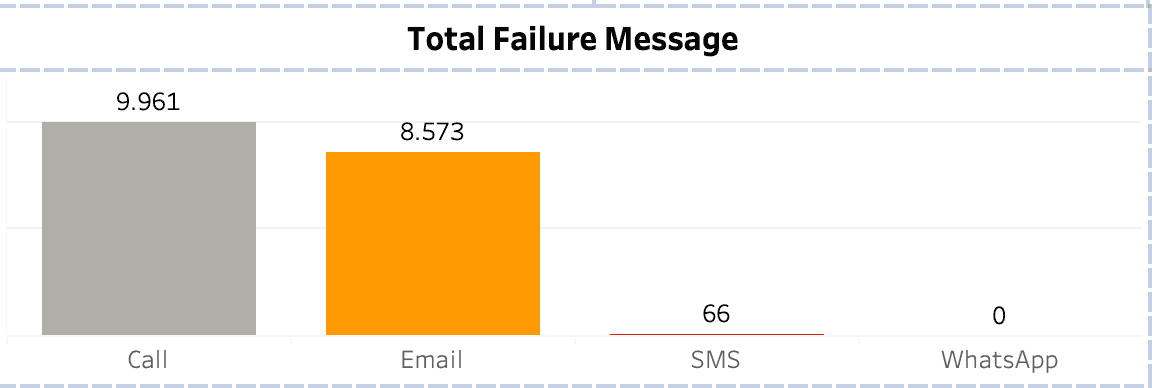
The second shows Total Success Messages per channel
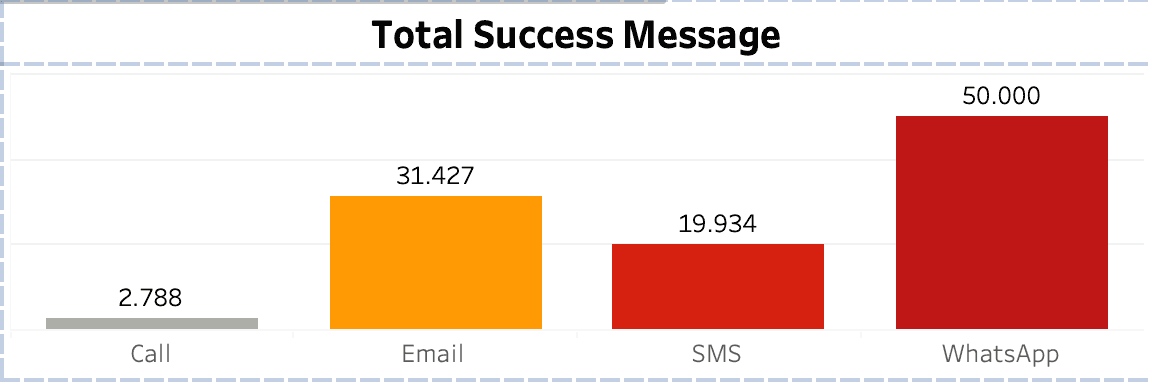
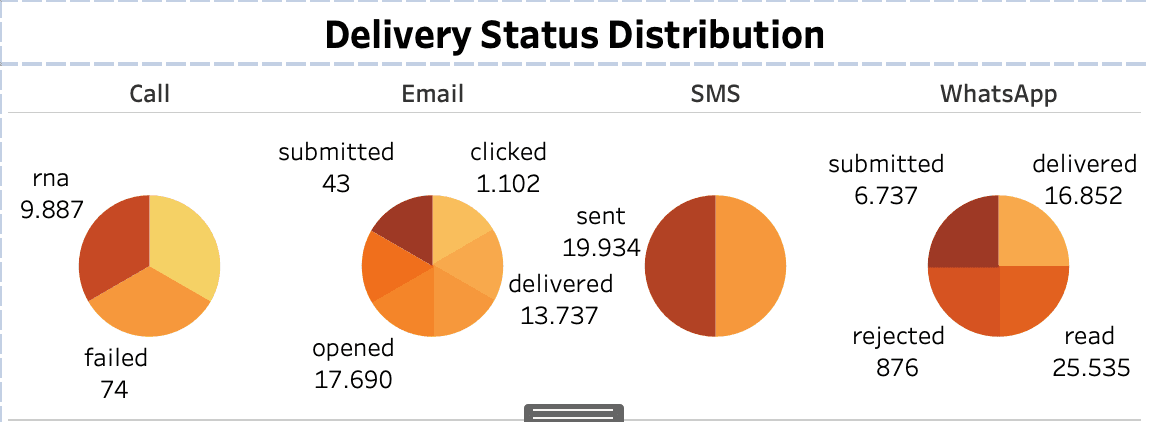
Then, I created a Channel Delivery Status Distribution, visualizing funnel stages (submitted, sent, delivered, opened/read, failed, rejected). This helped uncover where messages dropped off in each channel.
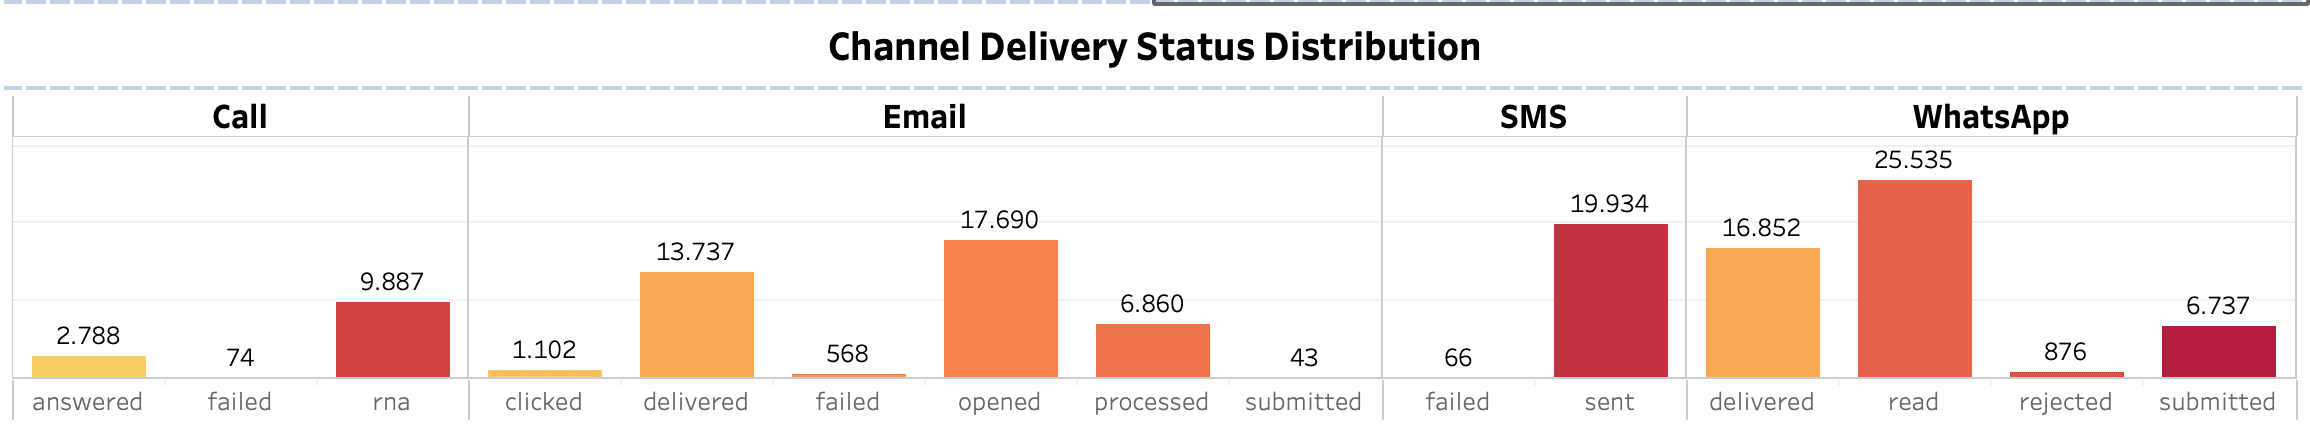
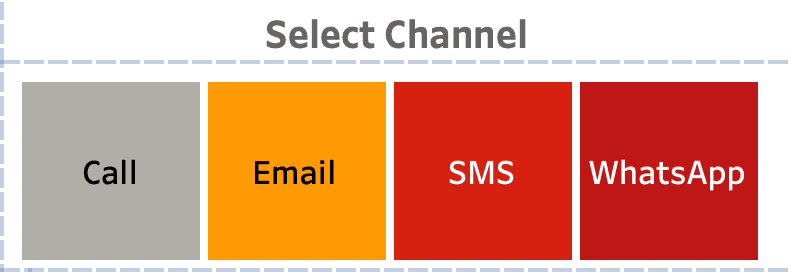
Finally, I added a channel filter for interactivity, enabling executives to zoom into WhatsApp, SMS, Email, or Call specifically and see performance details instantly.
All of these elements were then combined into a single dashboard that allows direct channel-to-channel comparison, highlighting WhatsApp and SMS as strong performers, while exposing Calls as the weakest channel.
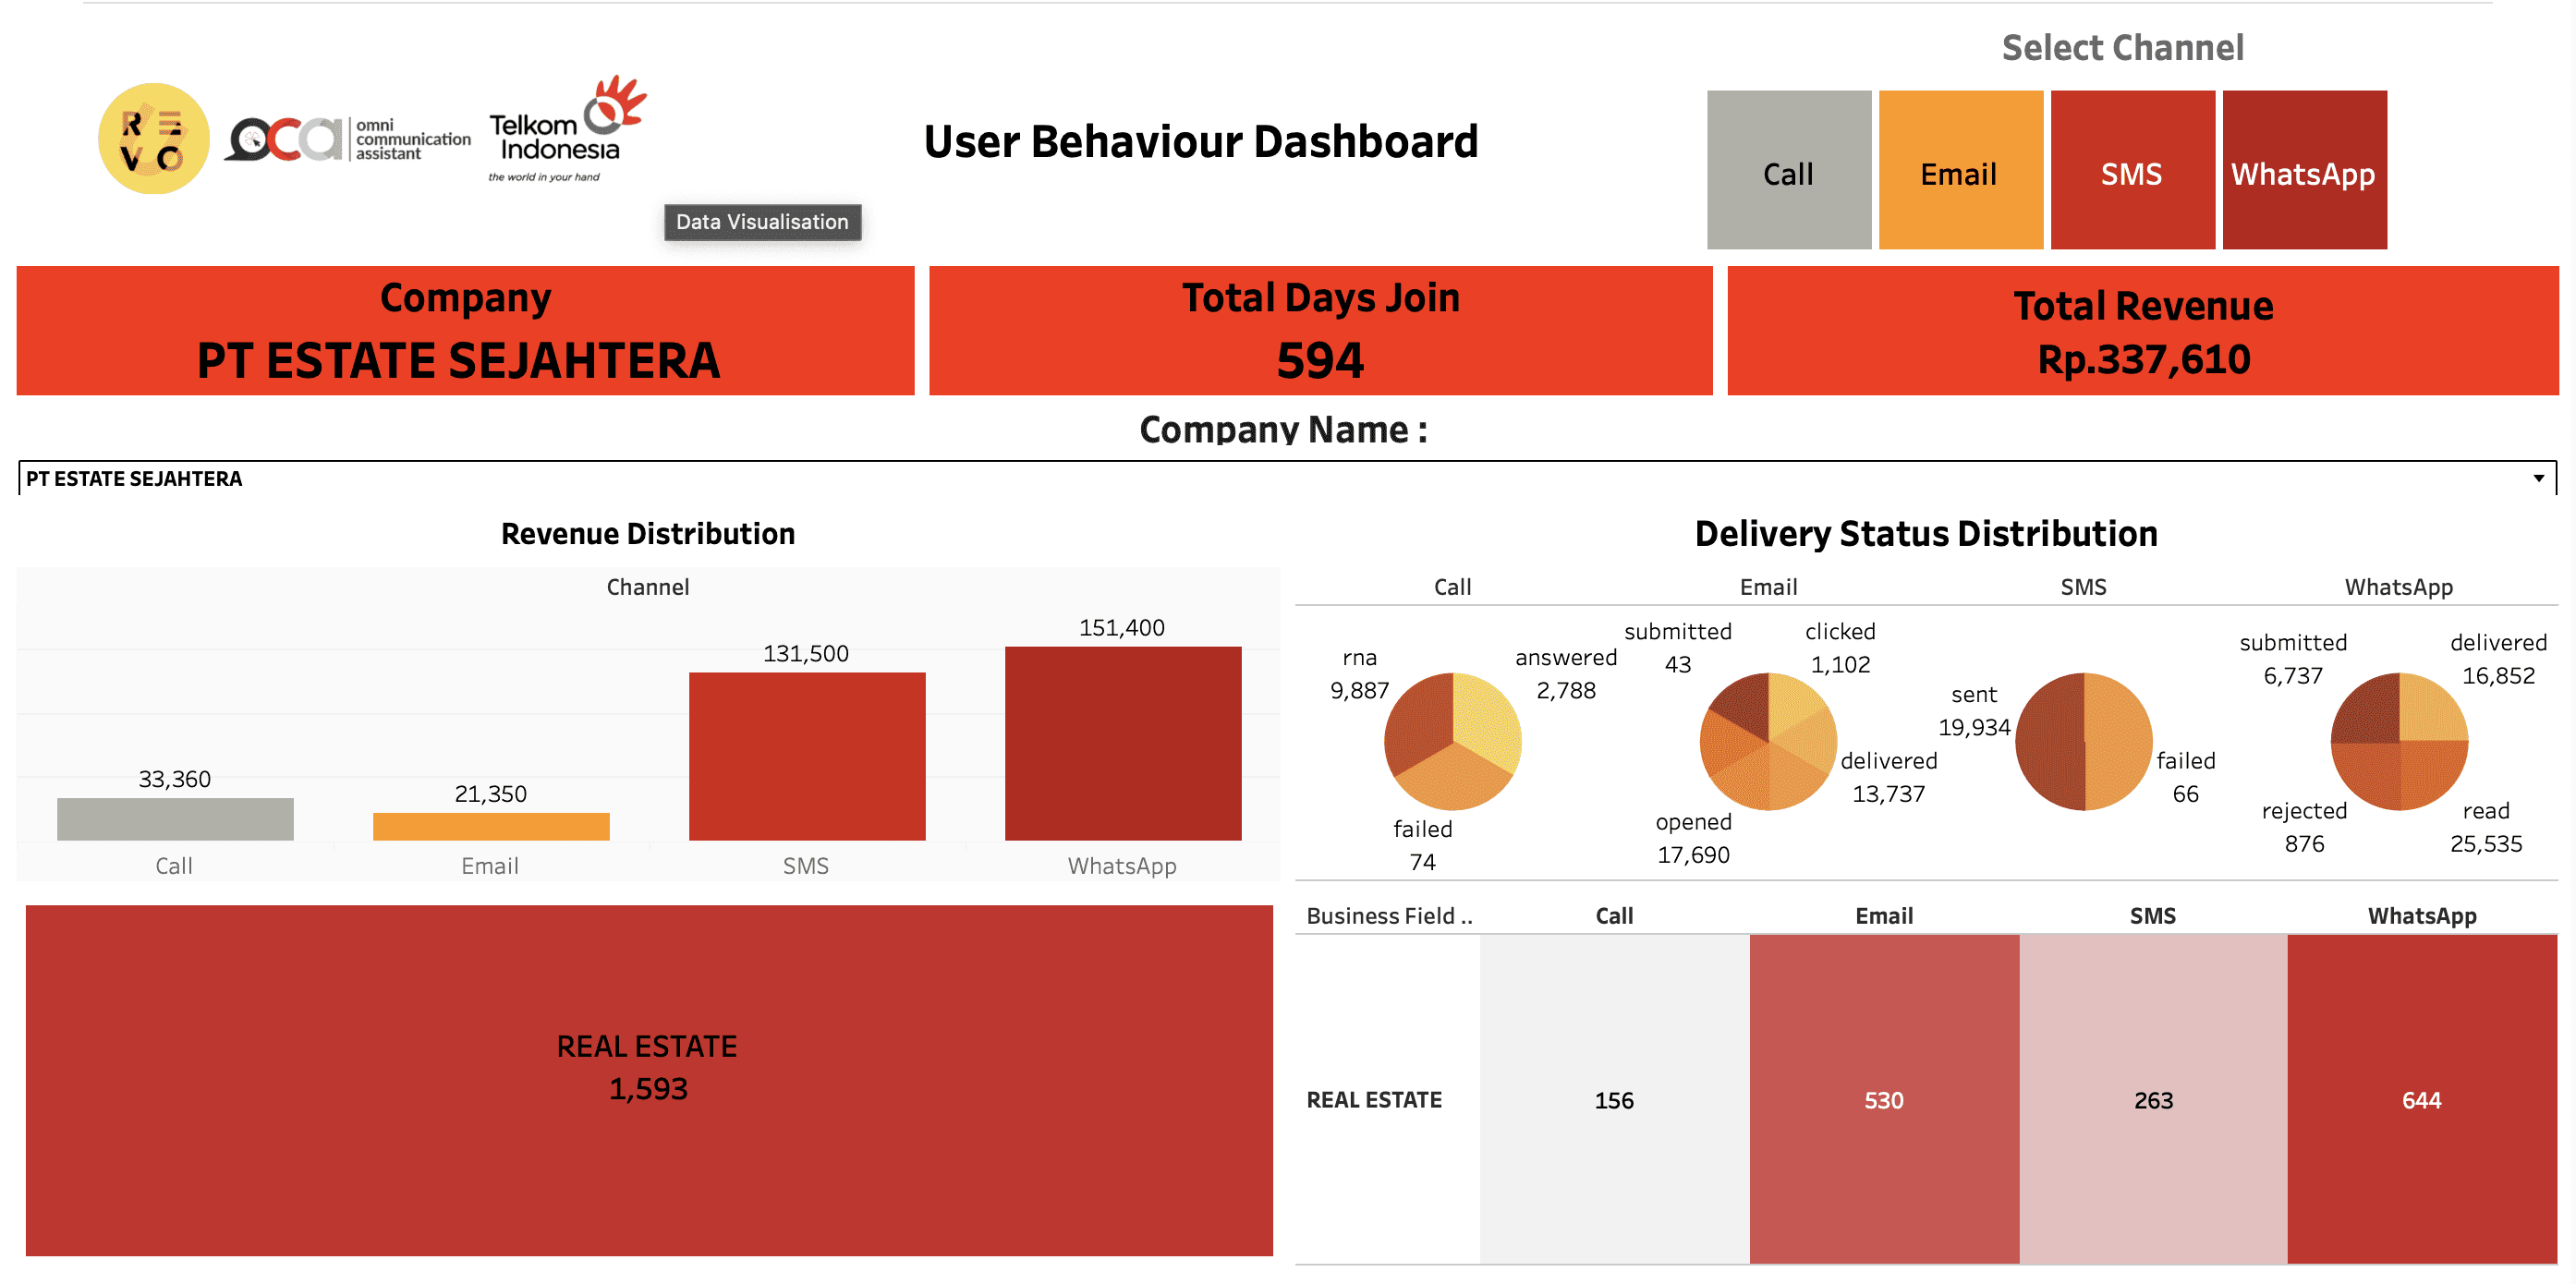
User Behaviour and Engagement Dashboard
For the User Behaviour and Engagement Dashboard, The objective was to analyze client-level engagement patterns, channel usage, and industry preferences, supporting personalized account management and targeted growth strategies.
My first step was to define client-level KPIs that would help analyze account engagement and revenue contribution. These were:
Company Name (Selected) – the client under review.
Total Days Joined – measuring how long the client has been active.
Total Revenue – financial impact from the selected client.

Next, I designed a bar chart for Revenue Distribution by Channel, allowing easy identification of which channel contributes the most revenue for each client.
Then, I added Delivery Status Distribution (donut charts) for each channel (Call, Email, SMS, WhatsApp), showing whether messages were delivered, read, opened, or failed.
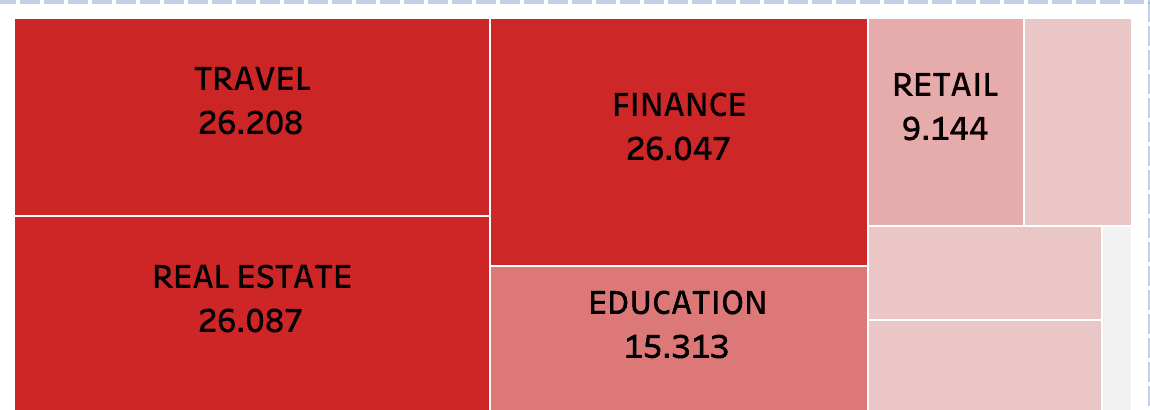
To give an industry-level perspective, I built a treemap that highlights Business Field Distribution, helping decision-makers see which industries drive the most communication.
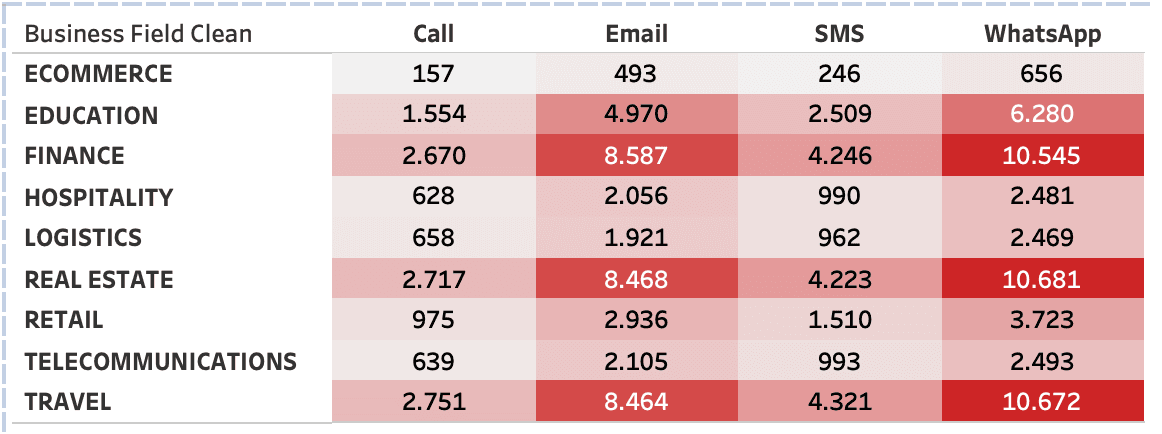
Finally, I included a heatmap (Business Field × Channel) that exposes industry-specific channel preferences—e.g., Real Estate and Finance favor WhatsApp heavily, while other industries rely more on Email.
Then implement the Company filter and Channel filter :
Company Filter
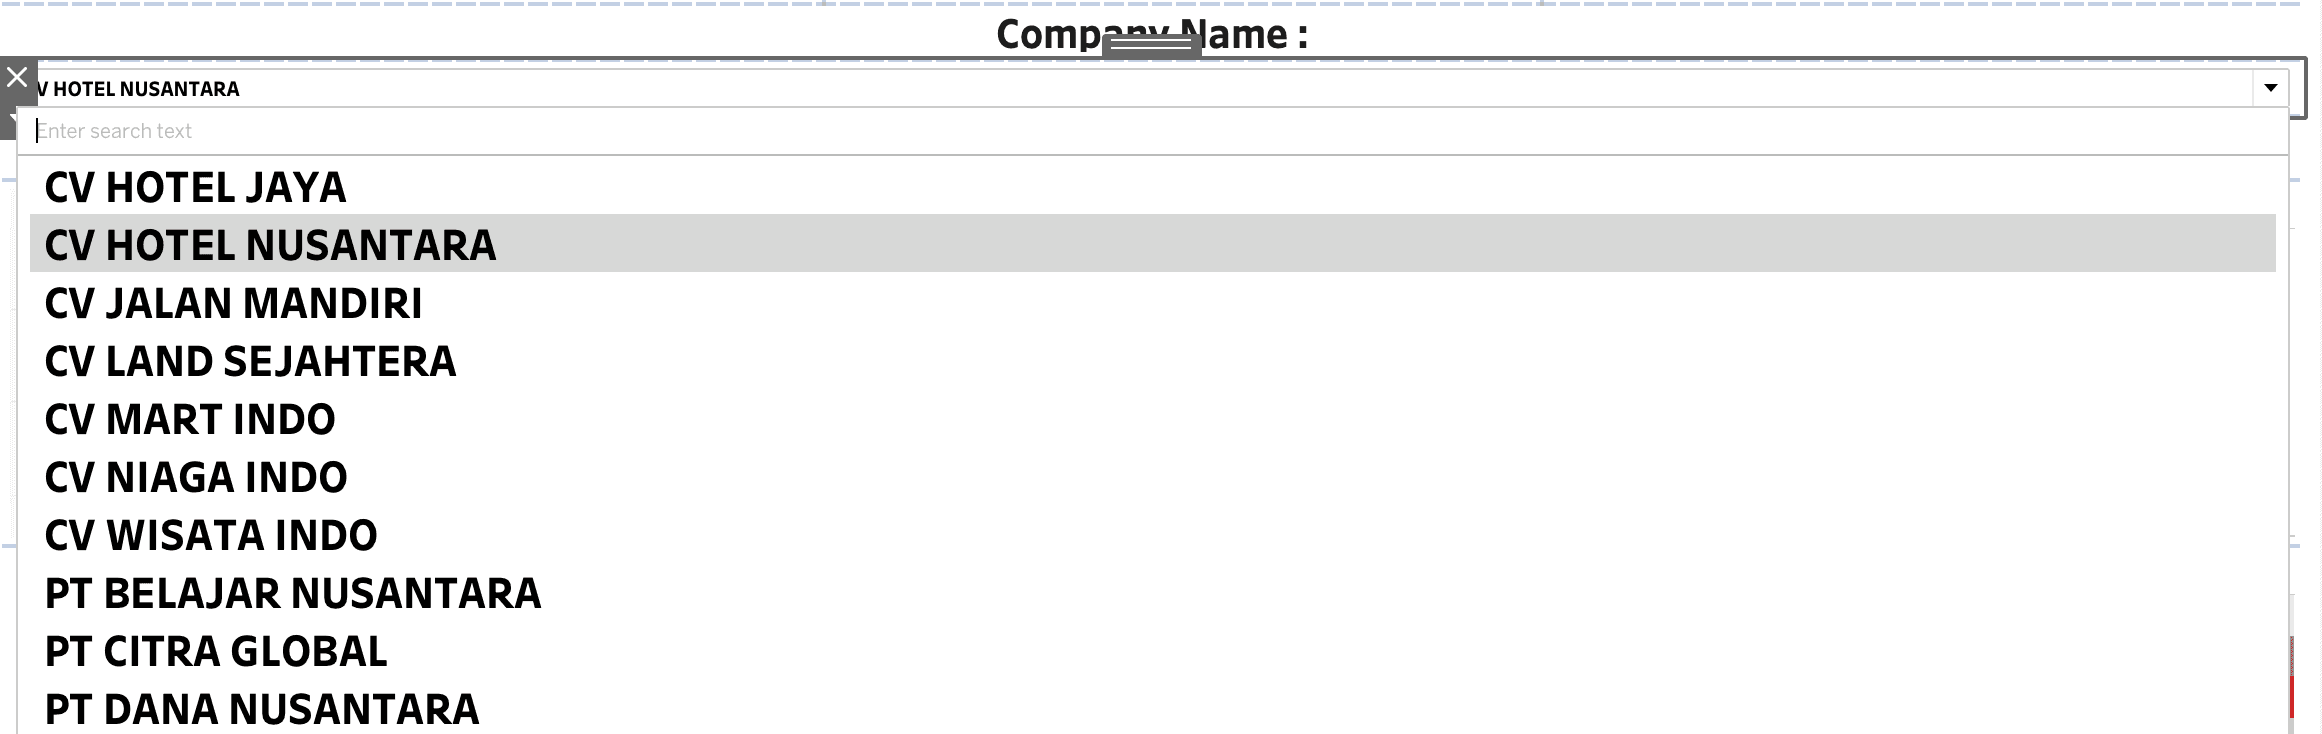
Channel Filter
And I combined the dashboard provides flexibility: leaders can analyze one account in depth, compare industries, or even benchmark multiple companies against each other.
Step 3
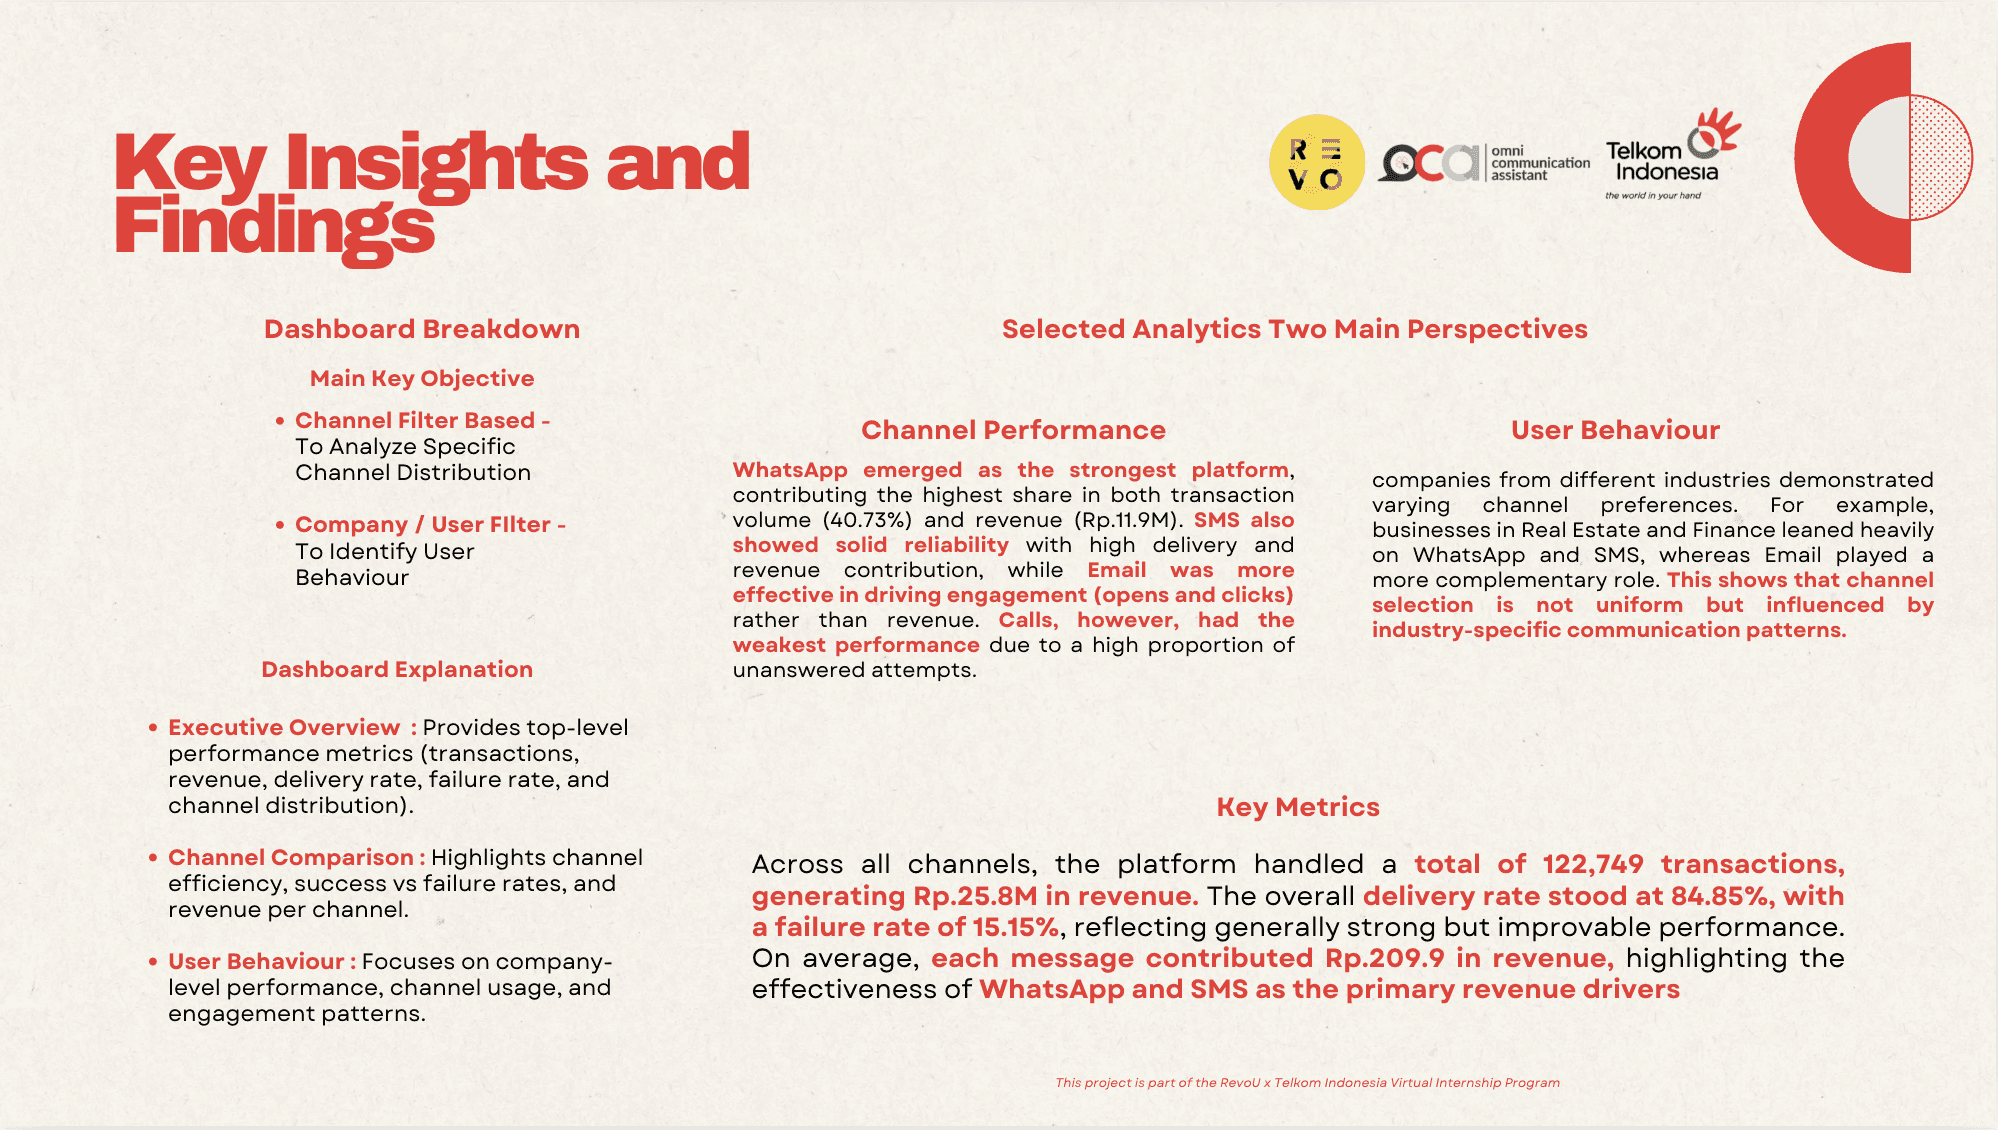
Key Insights and Findings
Overal Business Performance
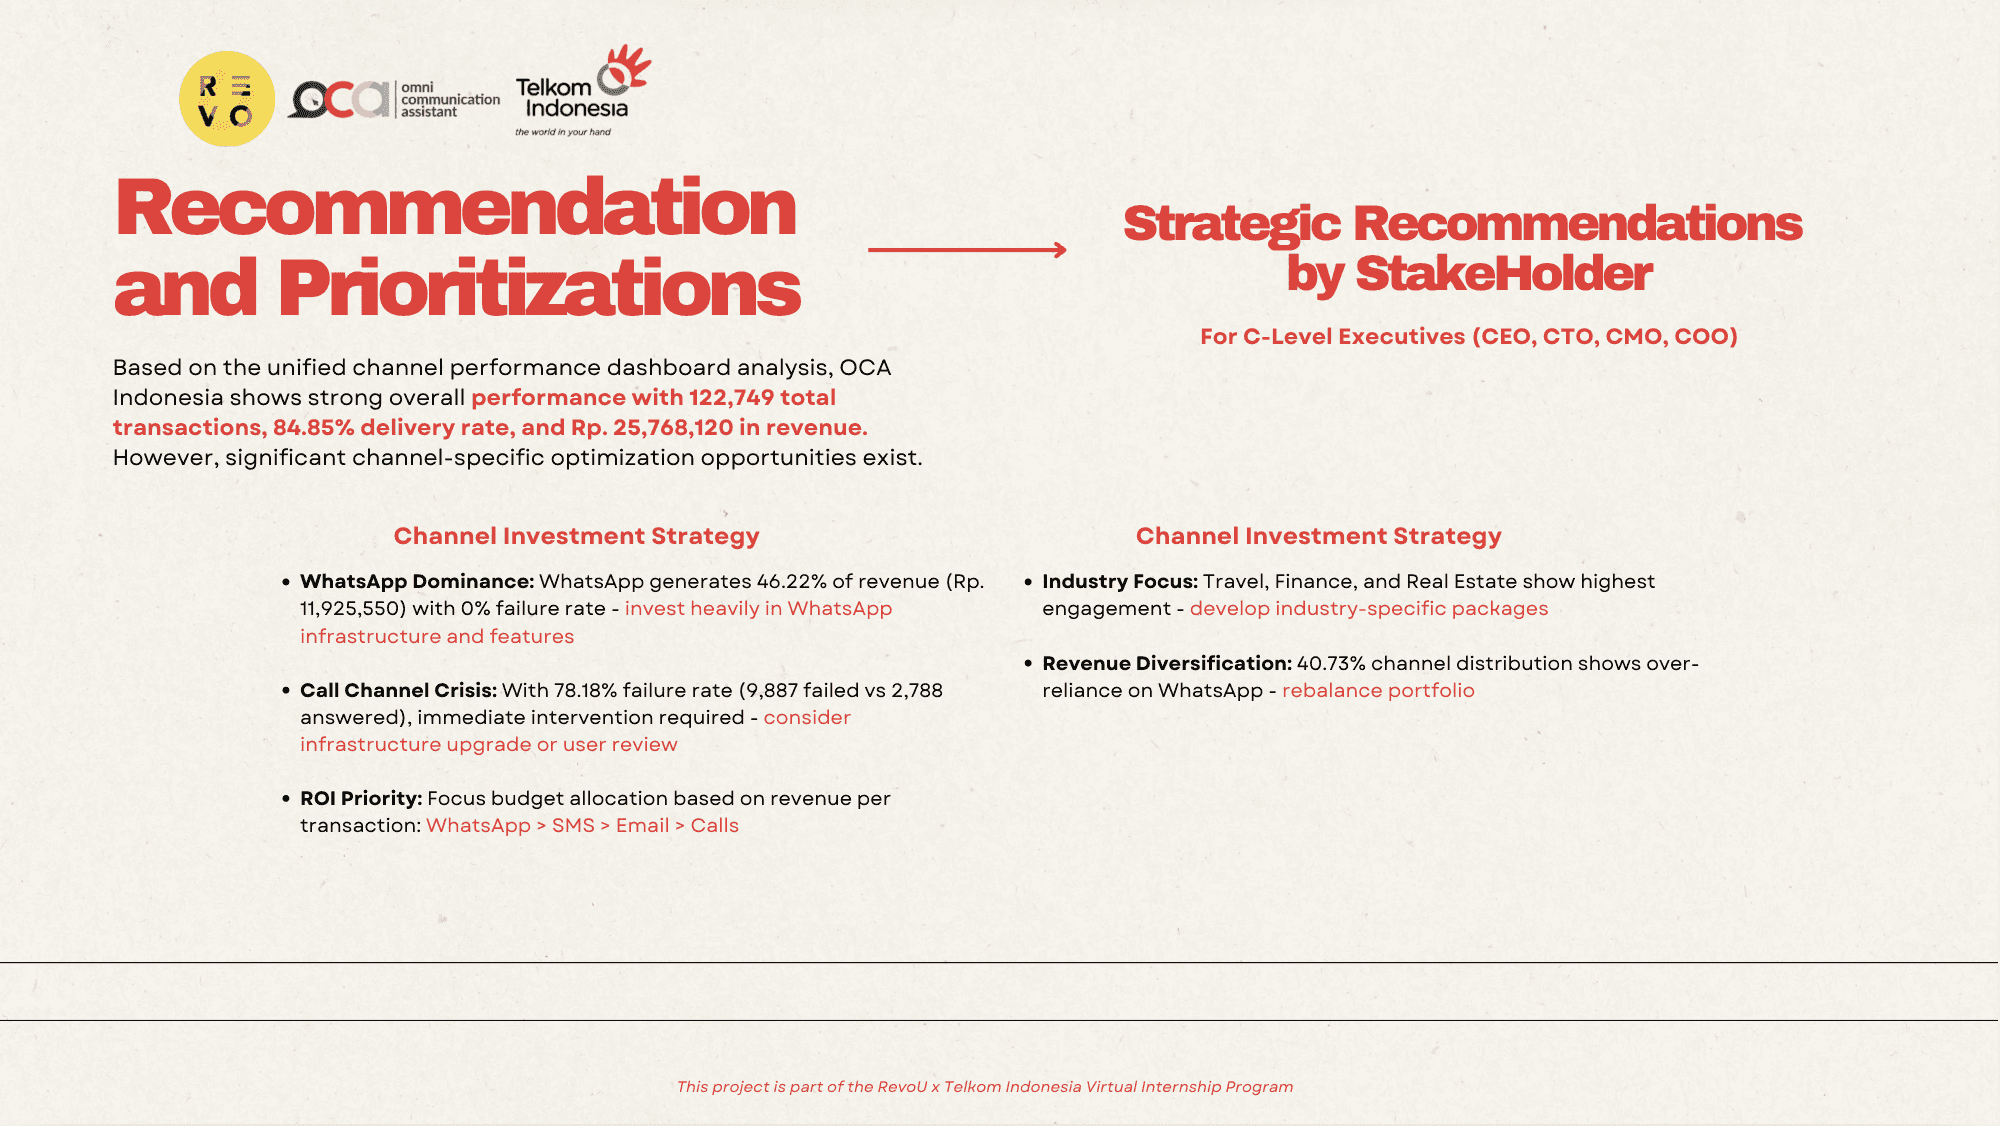
The platform processed 122,749 transactions, generating Rp. 25.8M in revenue.
The delivery rate reached 84.85%, but the failure rate of 15.15% signals optimization opportunities.
On average, each message contributed Rp. 209.9 in revenue, highlighting strong monetization efficiency, especially in WhatsApp and SMS.
Channel Performance
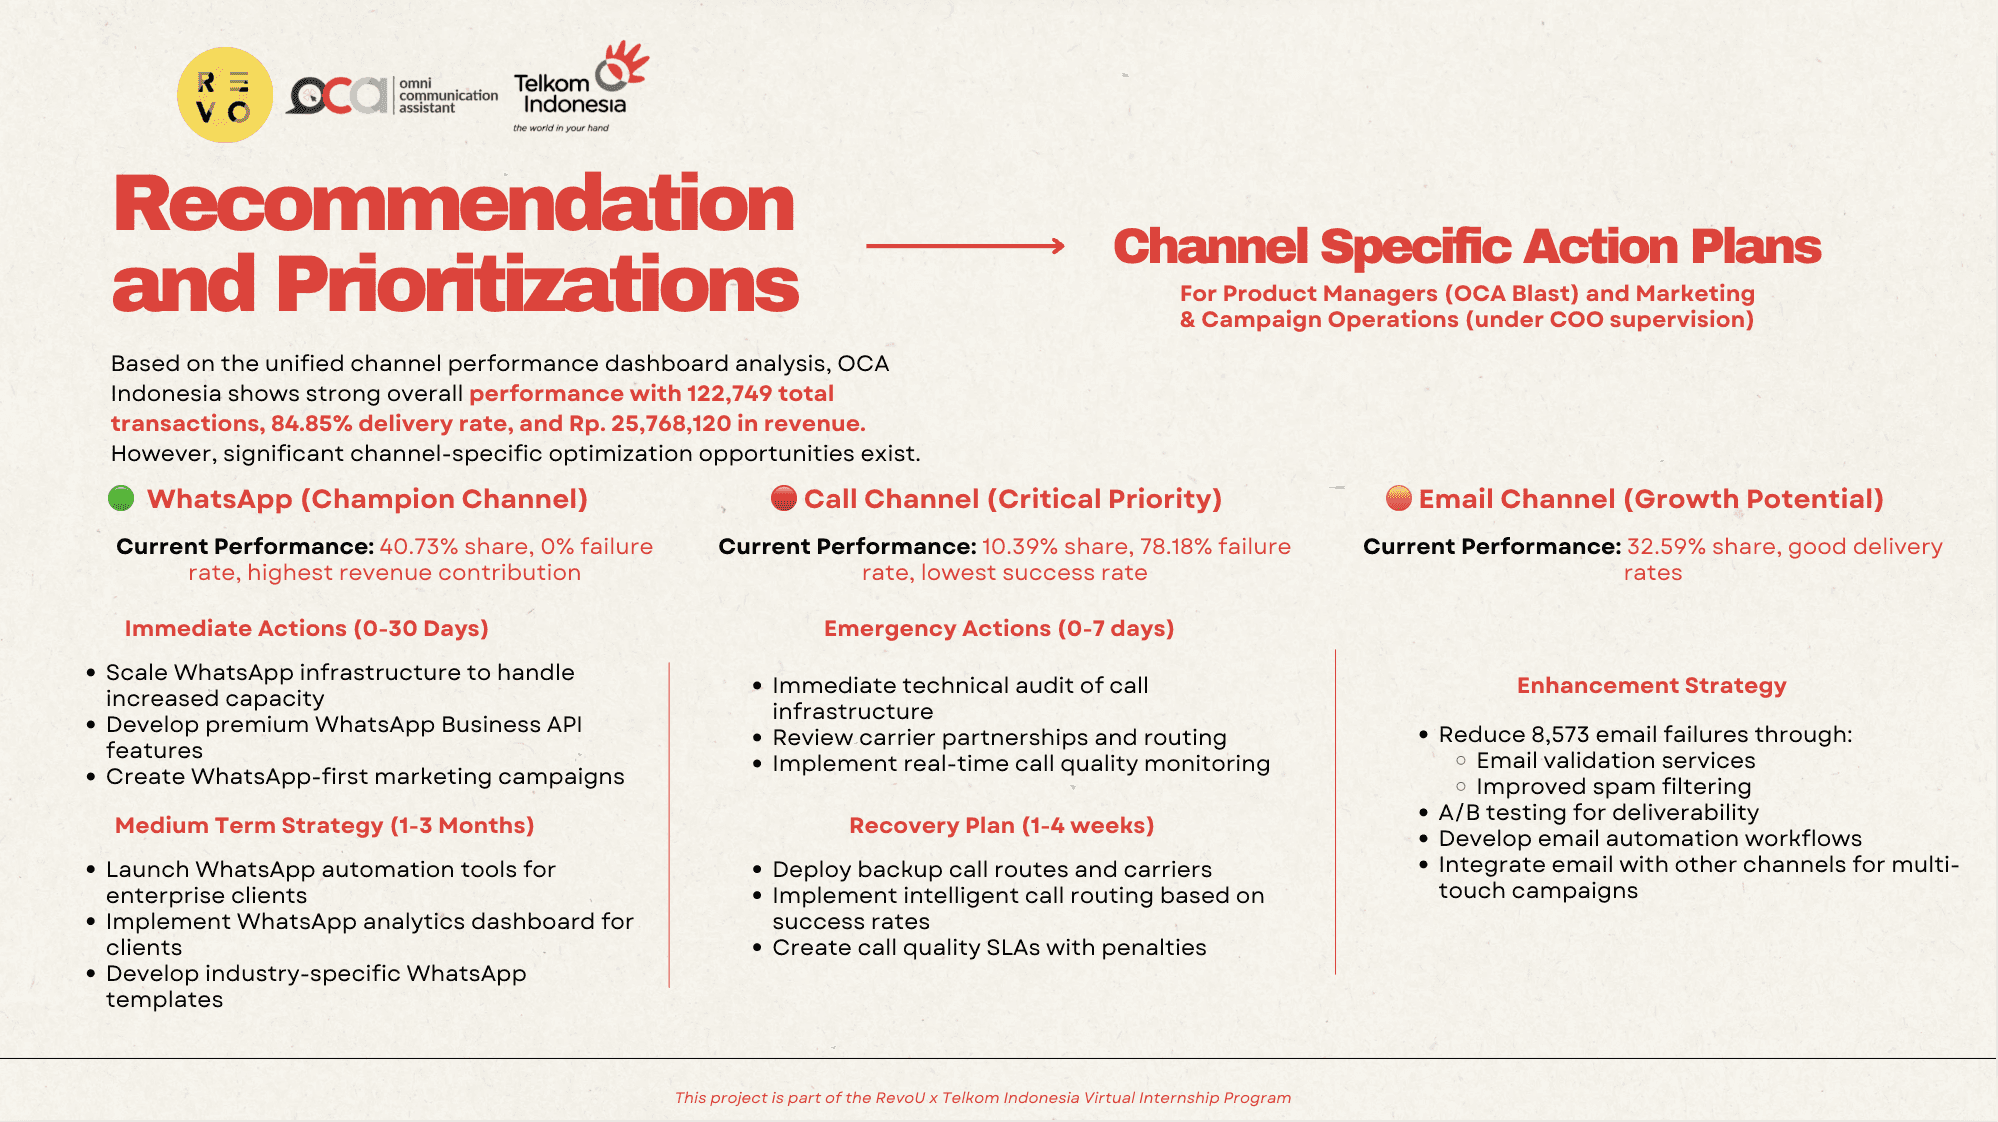
WhatsApp emerged as the strongest channel, contributing the largest share in both transaction volume (40.73%) and revenue (Rp. 11.9M), with a 0% failure rate.
SMS demonstrated solid reliability, combining high delivery with significant revenue contribution.
Email was less effective in direct revenue generation, but excelled in engagement metrics such as opens and clicks—making it valuable for nurturing rather than conversions.
Calls underperformed severely, with a 78.18% failure rate due to unanswered attempts, indicating urgent need for technical or strategic intervention.
User Behaviour and Engagement
Industry-specific preferences drive channel adoption:
Real Estate & Finance lean heavily on WhatsApp and SMS.
Education & Retail show more balanced use of Email alongside WhatsApp.
Top revenue-generating clients are concentrated in Travel, Finance, and Real Estate, reinforcing these as OCA’s strongest verticals.
Engagement funnels reveal that drop-offs vary per channel:
Email → high “opened” but lower “clicked” rates.
SMS & WhatsApp → stronger end-to-end delivery and read success.
Step 4
Actionable Recommendations
WhatsApp is the champion channel → warrants infrastructure scaling and advanced feature development.
Calls are in crisis → need immediate technical audits, better routing, or rethinking as a core service.
Email should be repositioned as a support/engagement channel rather than revenue driver.
Diversify channel reliance → with 40.7% of traffic tied to WhatsApp, OCA faces concentration risk if the channel is disrupted.
Industry-tailored strategies → customize channel mix for each sector (e.g., WhatsApp-first bundles for Finance & Real Estate; Email + WhatsApp campaigns for Education).
Strategic Recommendations By Stakeholder
Channel Specific Actions
In Summary OCA’s unified dashboard analysis uncovered that WhatsApp and SMS drive the bulk of revenue and reliability, Calls require urgent recovery, and Email plays a critical engagement role. At the user level, industry-specific channel preferences highlight the need for tailored strategies rather than a one-size-fits-all approach. These findings enable OCA to reallocate investments, strengthen operational efficiency, and design industry-focused packages to maximize both revenue and engagement